Packet Analysis With Wireshark & tcpdump
Prerequisites
- VirtualBox or VMware Workstation Pro Installed.
- Virtual Machine
[project-x-win-client]and[project-x-linux-client]are configured. - DNS settings are one of the following:
[project-x-dc]is powered on, DNS is set to10.0.0.5. DNS requests will flow through[project-x-dc].- DNS is set manually to
8.8.8.8. This guide will use this method.
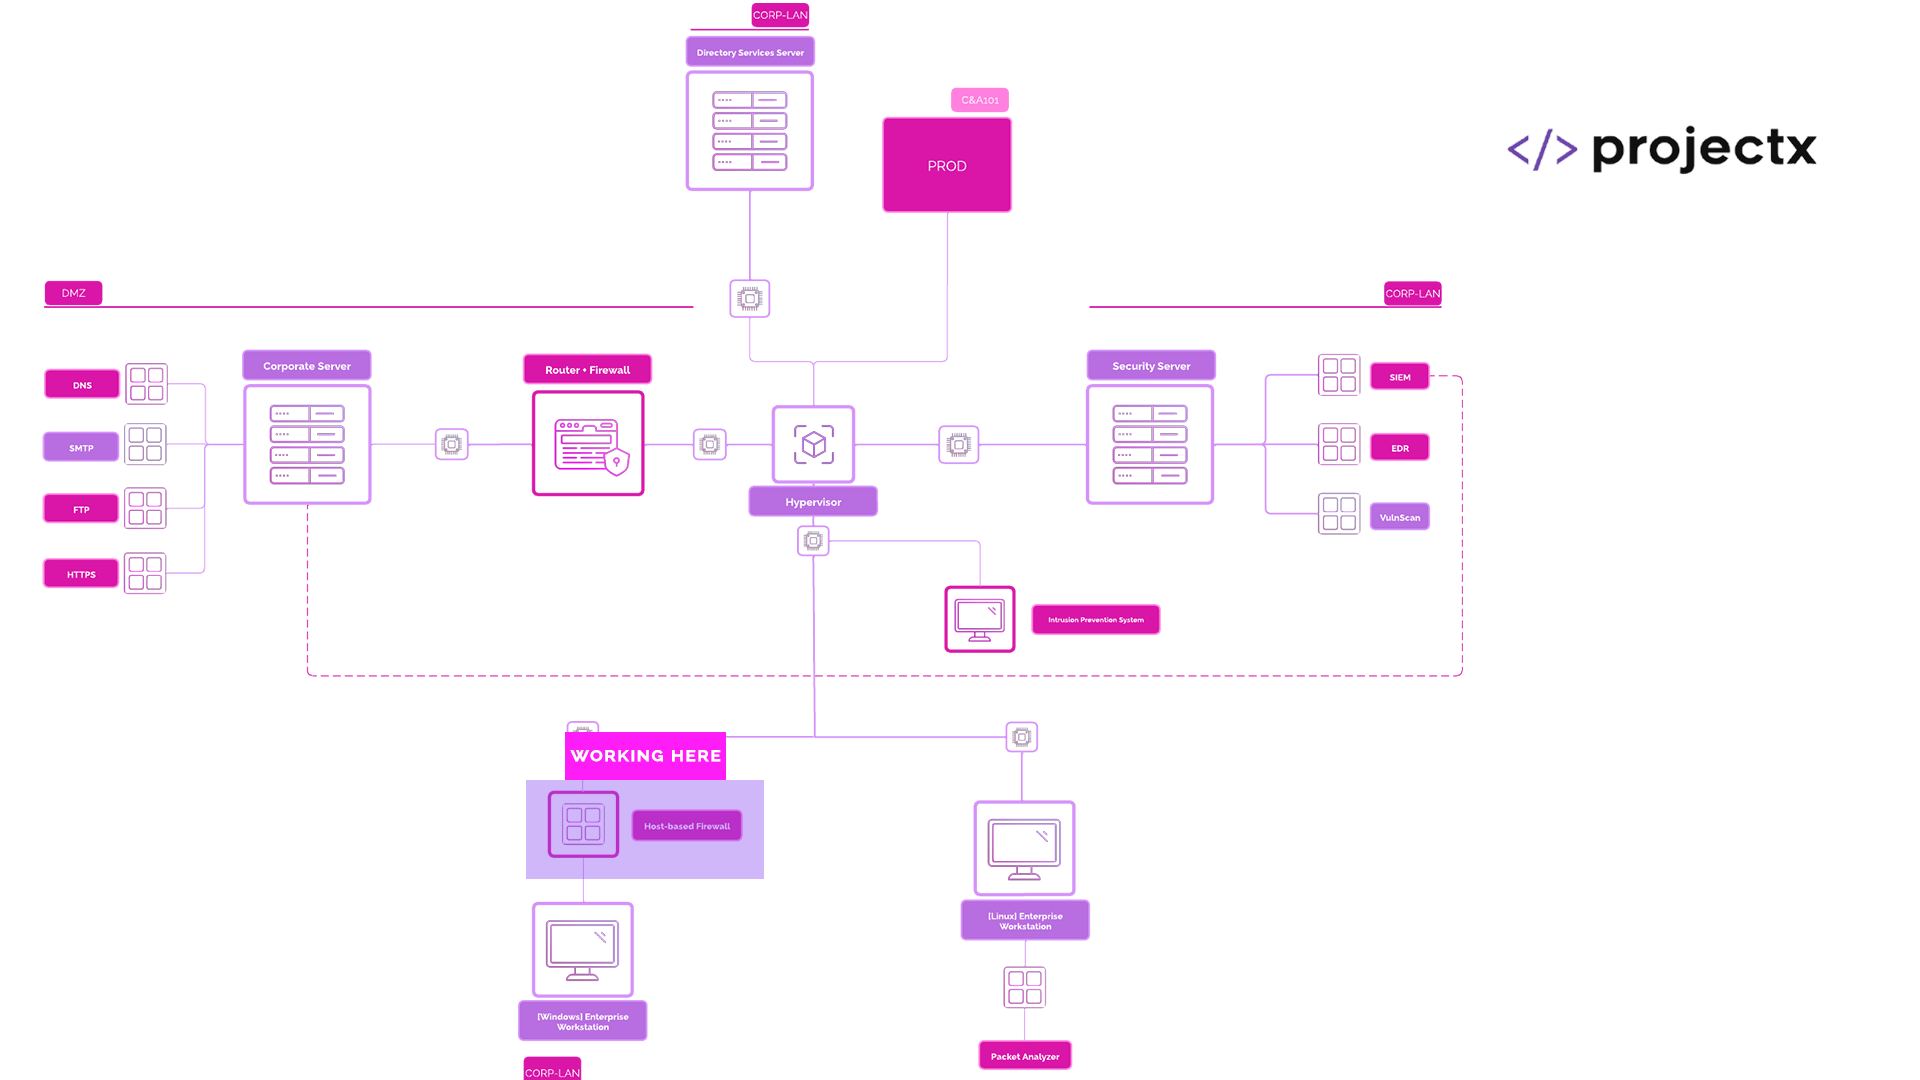
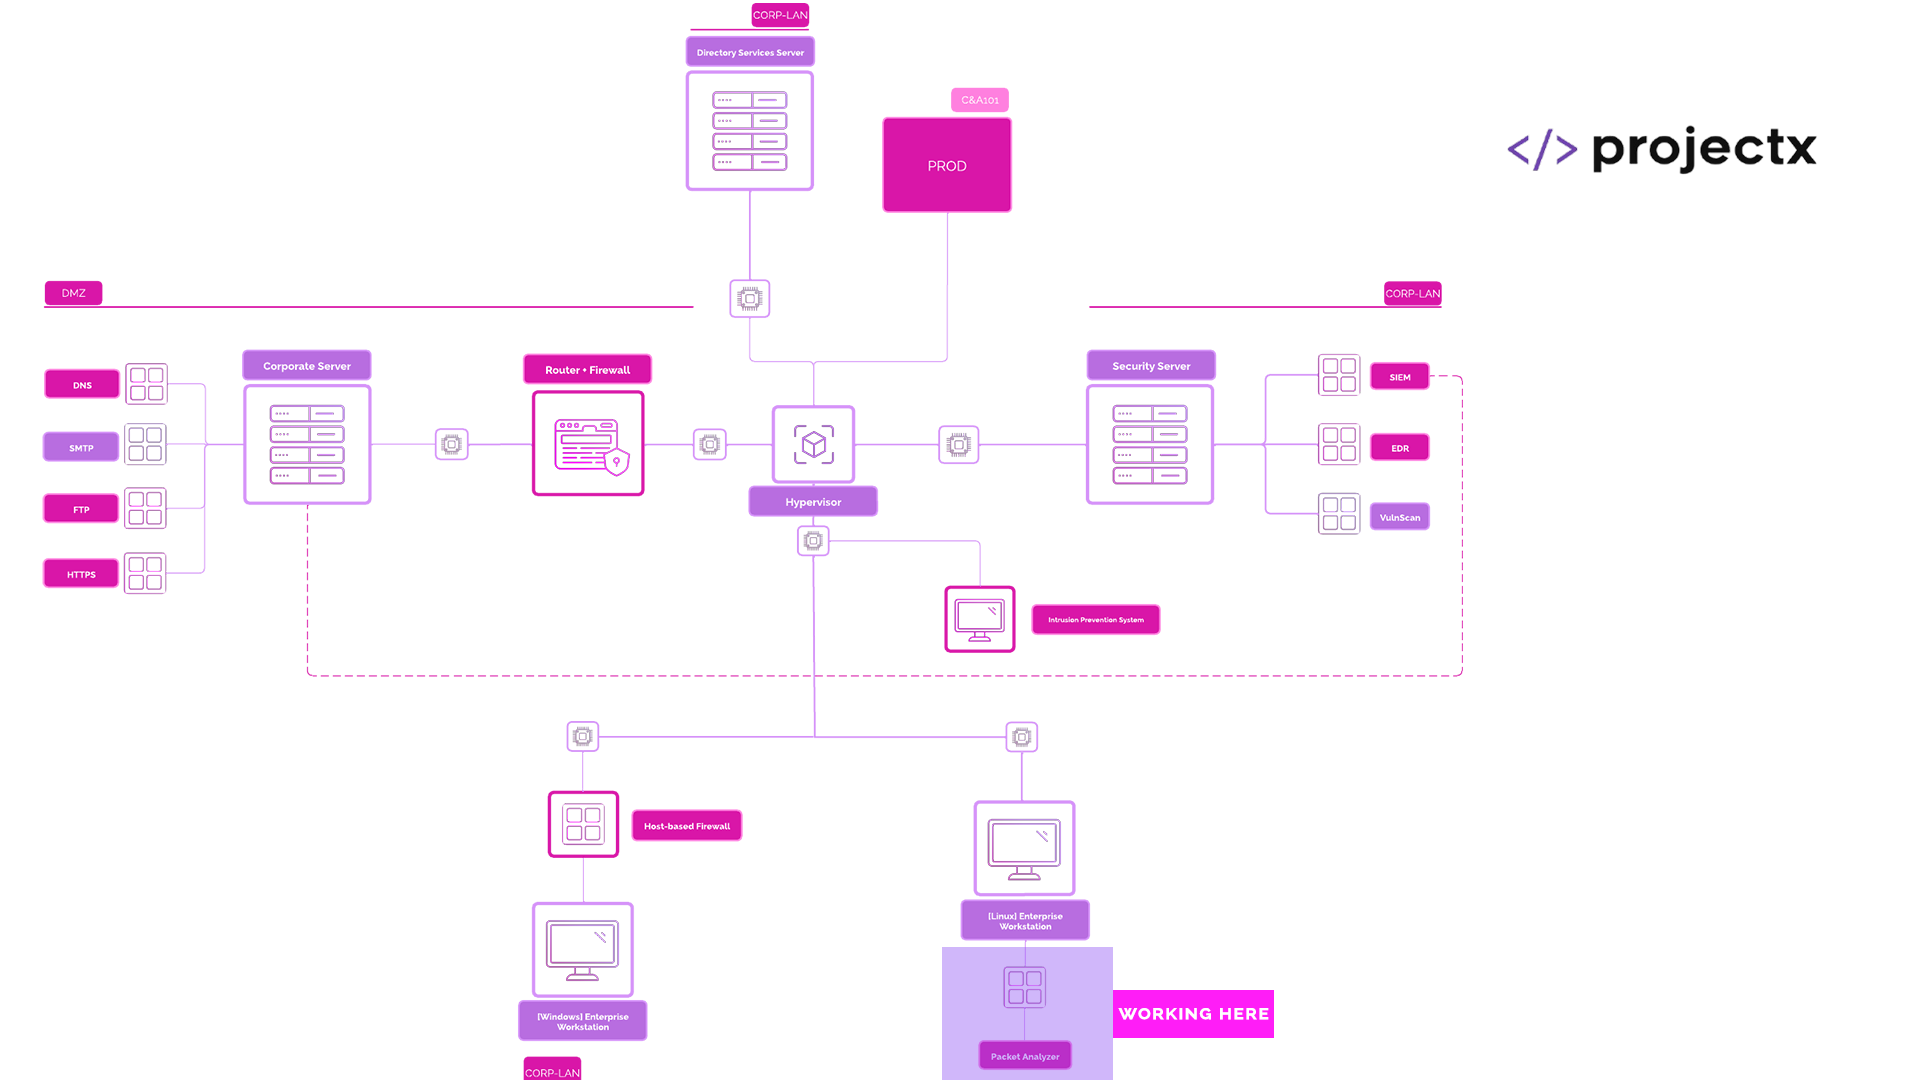
Network Topology
Packet Analysis Overview
Packet analysis involves capturing and examining data packets on a network to understand communication patterns, troubleshoot issues, or detect suspicious activity. It's a fundamental skill in cybersecurity and network forensics.
Packet Analysis Tools
There are many packet analysis tools offered, two of the most popular ones being Wireshark and tcpdump.
Wireshark
Wireshark is a graphical network protocol analyzer used to capture and interactively browse traffic on a network. It supports deep inspection of hundreds of protocols and provides powerful filtering options for detailed analysis.
tcpdump
tcpdump is a command-line packet analyzer used for capturing and analyzing network traffic in real-time. It's lightweight and effective for quick, scriptable inspections and remote diagnostics.
Security Implications
Packet analysis can reveal sensitive data transmitted in plaintext, identify unauthorized services or devices, and help detect malicious activity such as port scans, data exfiltration, or command-and-control communications. Proper use of encryption and segmentation can mitigate exposure.
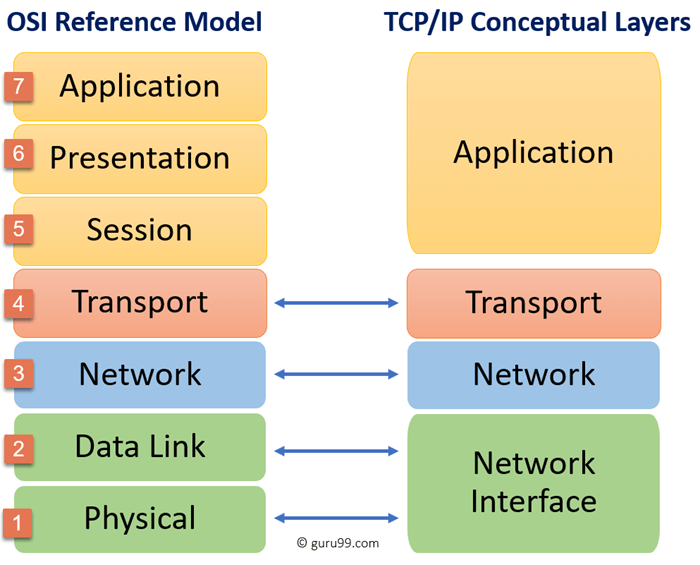
Analyze the TCP/IP Network Stack
Packet Analysis tools can be great ways to visualize a working example of how the TCP/IP stack is implemented.
Here's a quick diagram of the TCP/IP & OSI Model Layers.
Wireshark
Download
-
Download Wireshark here using this link onto
[project-x-win-client]. Run through all defaults on the installation wizard. -
You will be prompted for the Administrator Password.
Let's use Wireshark to capture a network packet and analyze the TCP/IP network stack.
Wireshark is super user friendly.
Let's initiate a capture in Wireshark and navigate to projectsecurity.io as our example.
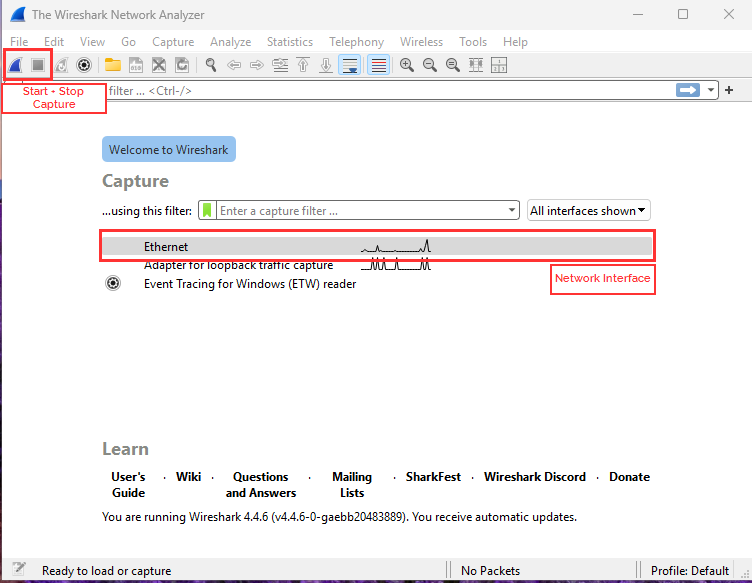
1) Open Wireshark.
2) Select the network interface.
3) Start Capture.
4) Traffic will start generating. Go browser and type https://projectsecurity.io.
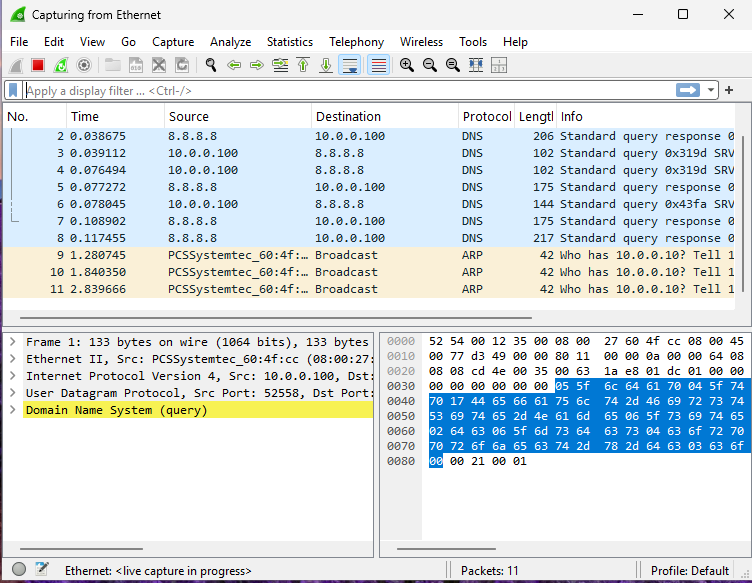

5) Stop Capture.
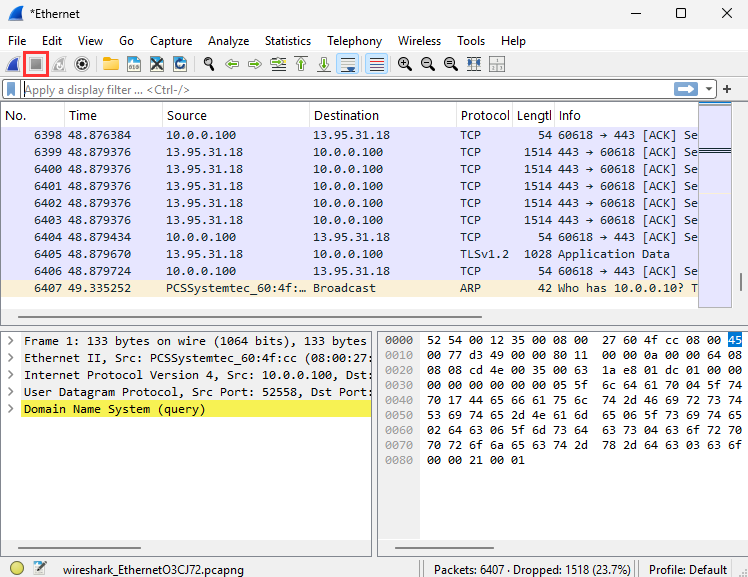
Wireshark will generate a lot of data quickly. As you can see, even without navigating to a website, there is a lot of background network traffic happening. It's kind of cool to realize this is happening all the time while you are on your computer.
Wireshark does offer filters to help parse through the noise.
You can filter on a lot of information. A primary one being the protocol.

Packet Capture
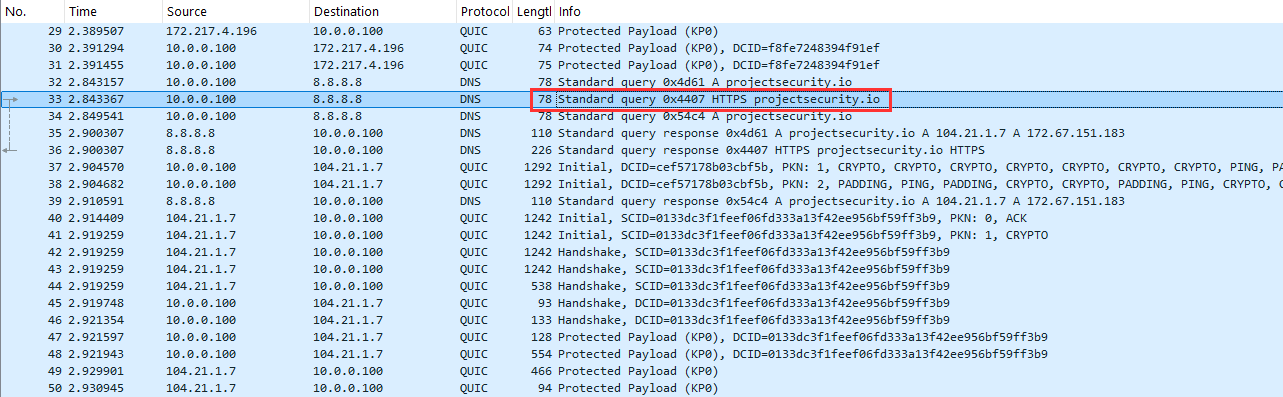
Once you have navigated to projectsecurity.io, you can stop the capture.
Look for a DNS network packet that has the following in the Info column.
- If you can't find this packet. You can choose any packet with
projectsecurity.ioin theInfotab.
We will now be analyzing the following tabs.
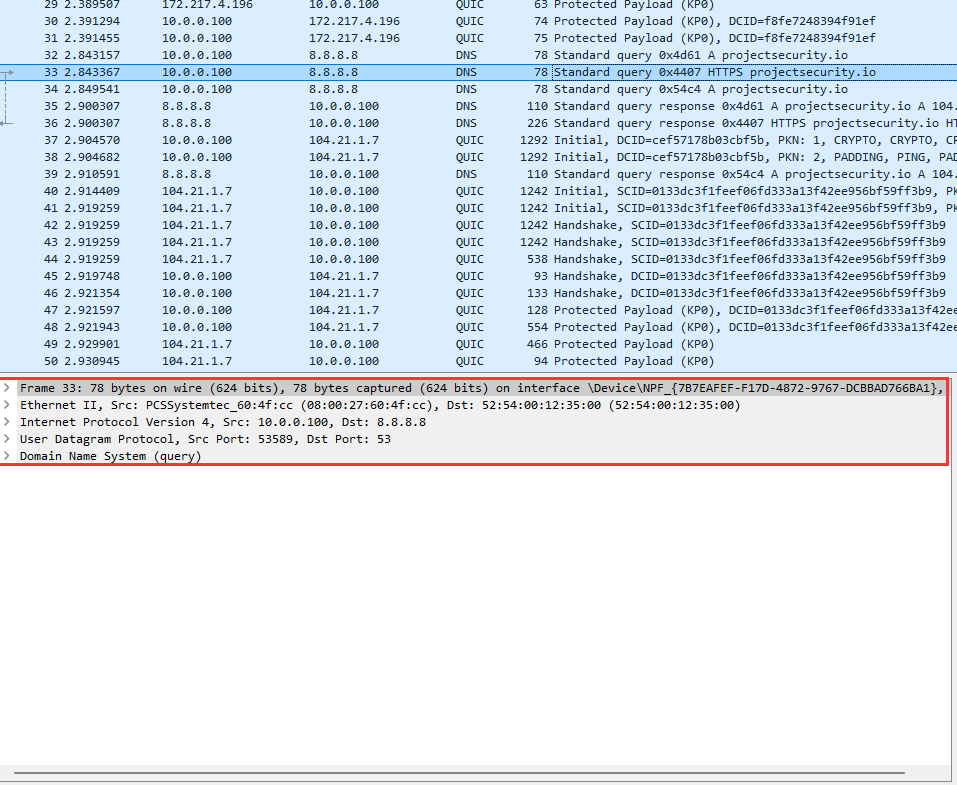
Frames
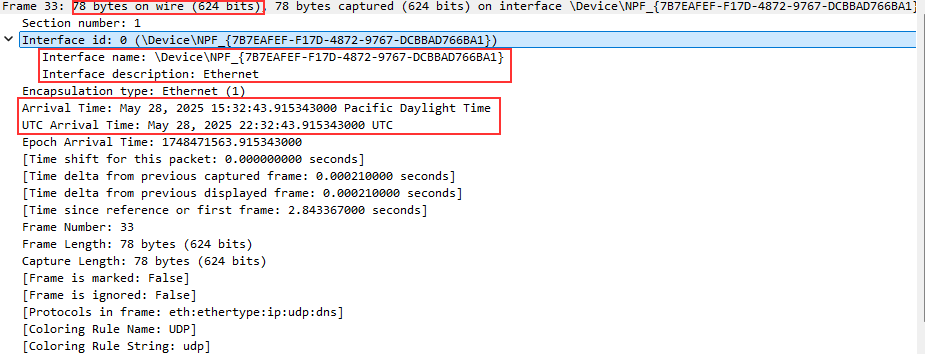
Let's start with the Frame.
The frame section has Ethernet information, which means it is local. This shows the frame size, time of capture, and the physical interface the frame work captured on.
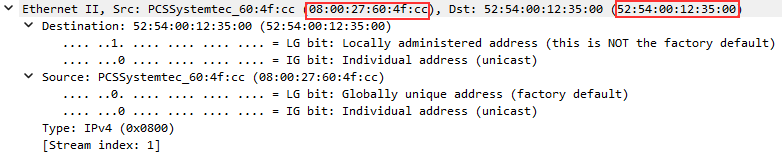
Next we can see the Ethernet content.
Here we see the source and destination MAC addresses. These are the local identifiers for the physical device, such as your computer.
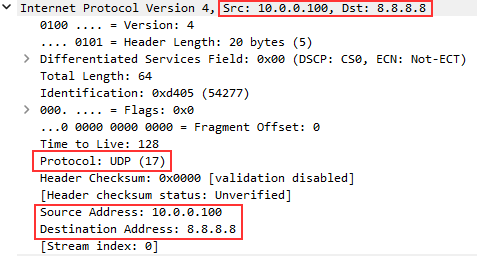
IP Content
Next we see the IP content with the source and destination IP addresses and port numbers.
We can see the protocol being used in the transport layer.
Network technicians can verify that the IP addresses are valid and expected.
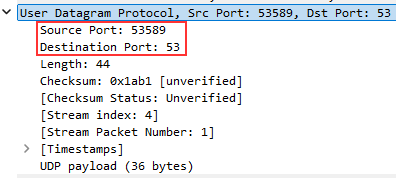
Transport
The transport layer will also show either TCP or UDP here, depending on what type of protocol is being captured.
In this layer, we can also see source (Src Port) and destination ports (Dst Port).
Remember, ports are numerical identifiers of services.
If the destination for this packet is a web request, we will see ports 80 or 443.
We can also see another port number called (Dst Port). Yours will be different than this screenshot.
The client port (Dst Port) looks random, why is this?
- A client's port number is randomly generated when initiating the request to the web server. It will be a randomly generated number between 1024 and 65535.
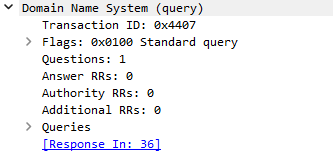
Application
And finally, the top layer.
This layer will populate depending on what protocol we are using. In this case, it's a DNS request.
If this were an HTTP request, we might see instructions such as the HTTP method of GET. And the URL.
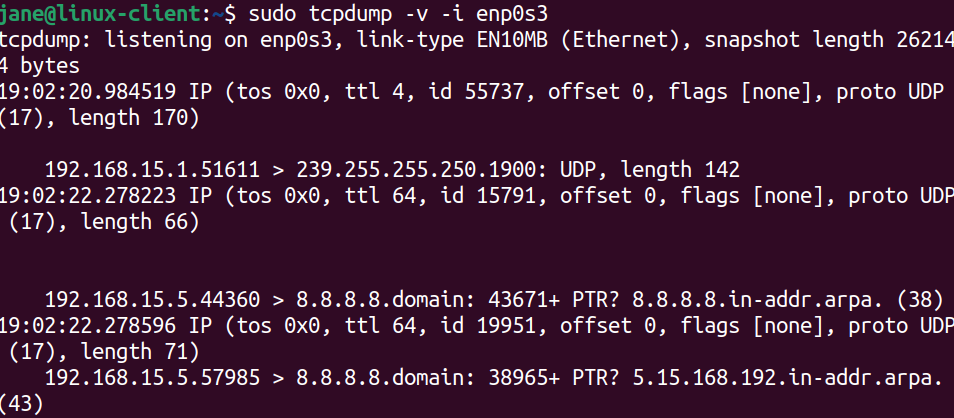
tcpdump
tcpdump is another packet capture tool we can leverage. tcpdump is a command line program.
It's available on most Unix/Linux systems and requires root privileges to capture packets on interfaces.
tcpdump is great to use for quick analysis to see if network traffic is traversing through.
Type sudo tcpdump -v -i enp0s3.
You should start to see network traffic come in through terminal output. You may have to hit the Enter key to refresh the screen.
What else can we do?
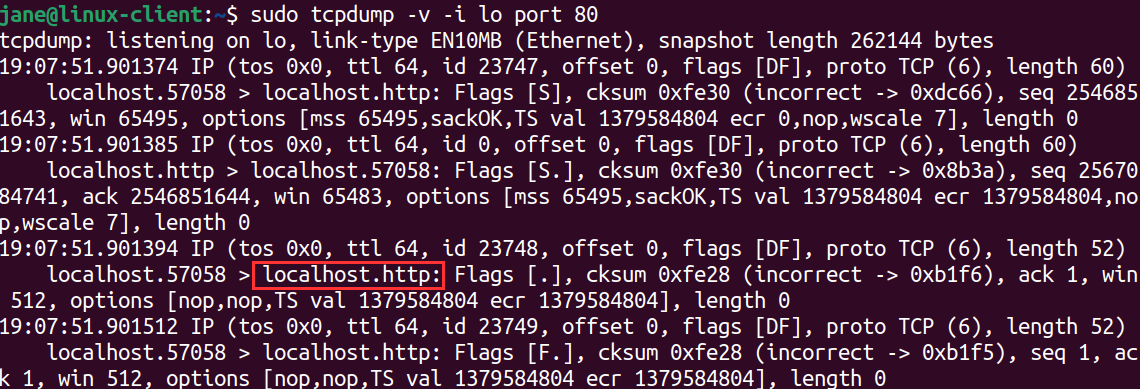
We can capture traffic on a specific port
sudo tcpdump -v -i lo port 80.
Open up two additional terminal tabs.
On the first tab:
sudo nc -lv 80
Second tab:
nc -vz localhost 80.
We now have three terminal tabs opened.
If we go back to our first tab, we should see traffic on our lo interface, which is our local or loopback interface.
We can also write to a PCAP capture file.
sudo tcpdump -i enp0s3 -w capture.pcap.
We can then read from the capture file with.
tcpdump -r capture.pcap.
We can also combine filters.
sudo tcpdump -i enp0s3 tcp and port 80 and src 192.168.1.5
This listens on enp0s3, tcp, for http traffic from a source address of 192.168.1.5.
tcpdump is a swiss army knife of network packet capture, it has a lot of cool functionalities.
Feel free to Google or LLM search for more information on tcpdump.