Security Log Ingestion
Prerequisites
- VirtualBox or VMware Workstation Pro Installed.
- Virtual Machine
[project-x-sec-work]is turned on and configured. - Virtual Machine
[project-x-corp-fw]is turned on. - Optional - Virtual Machine
[project-x-attacker]is turned on.
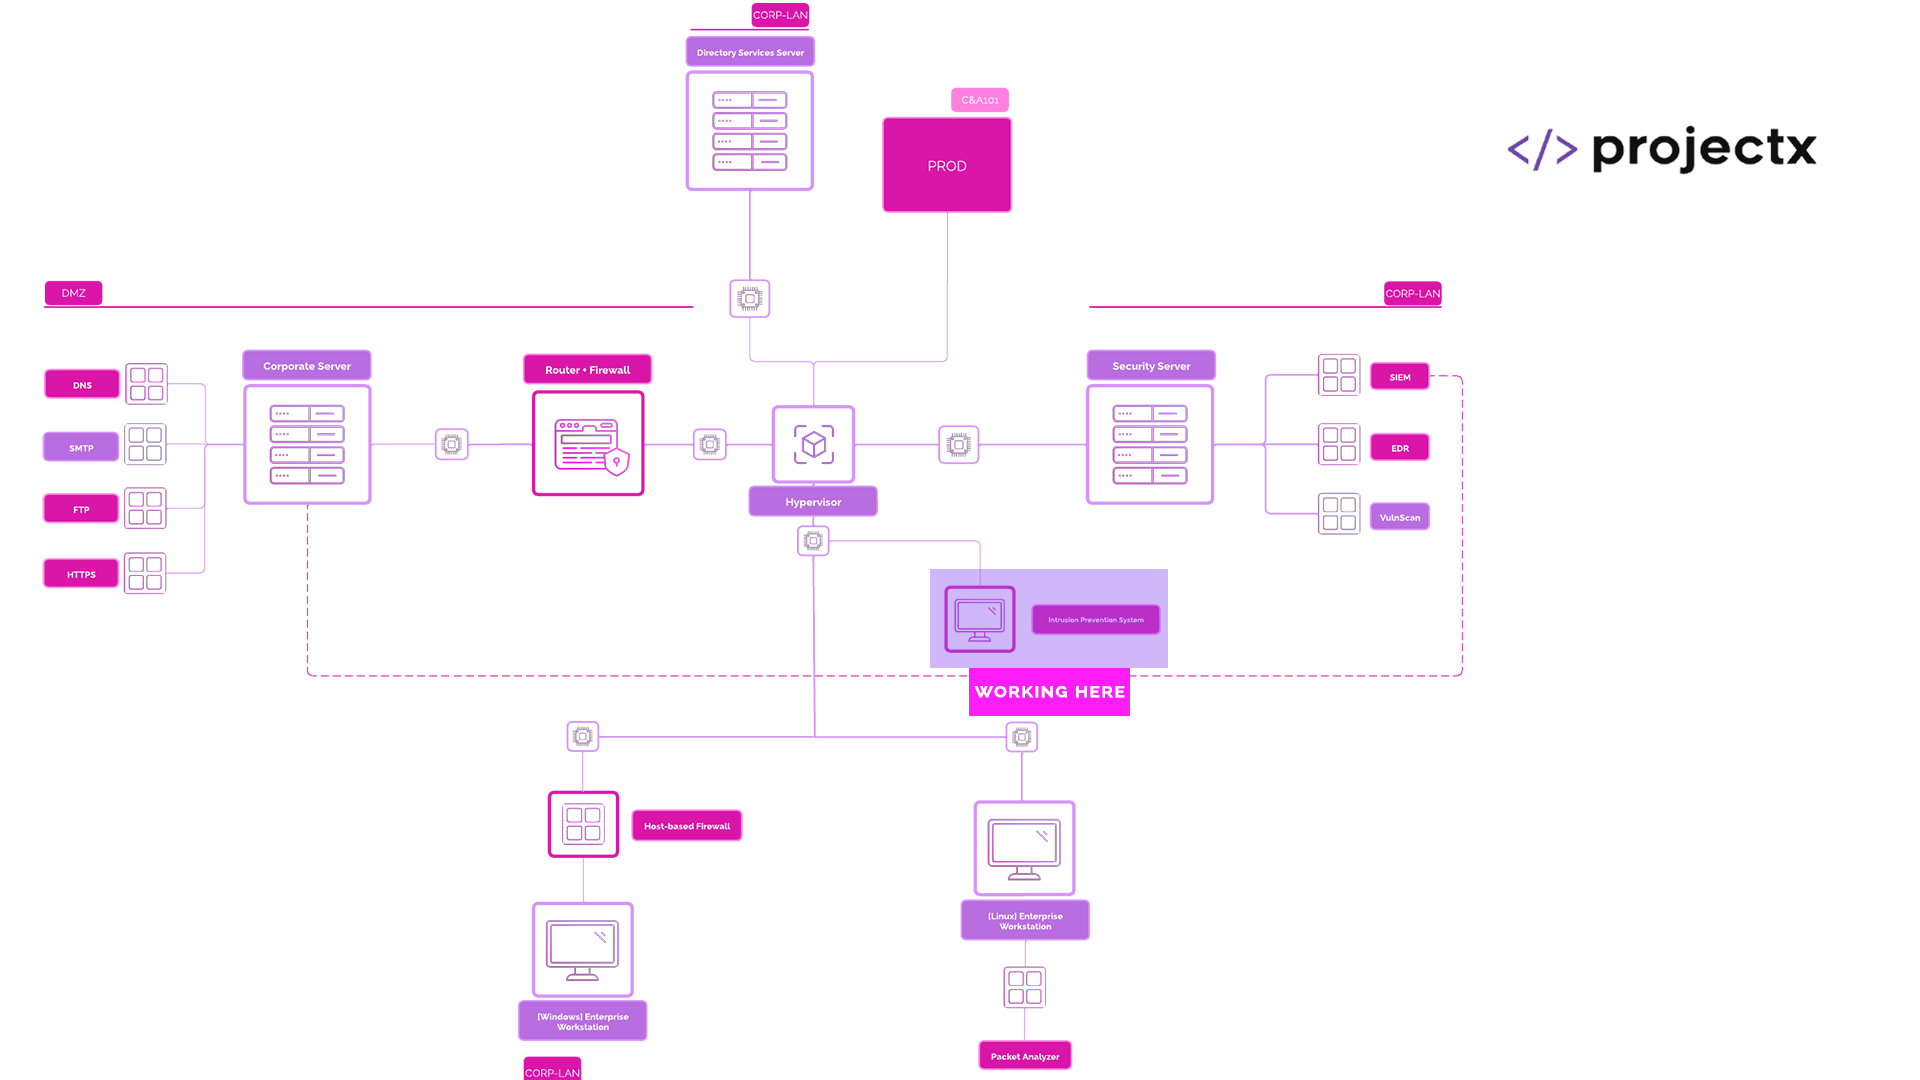
Network Topology
Part 1
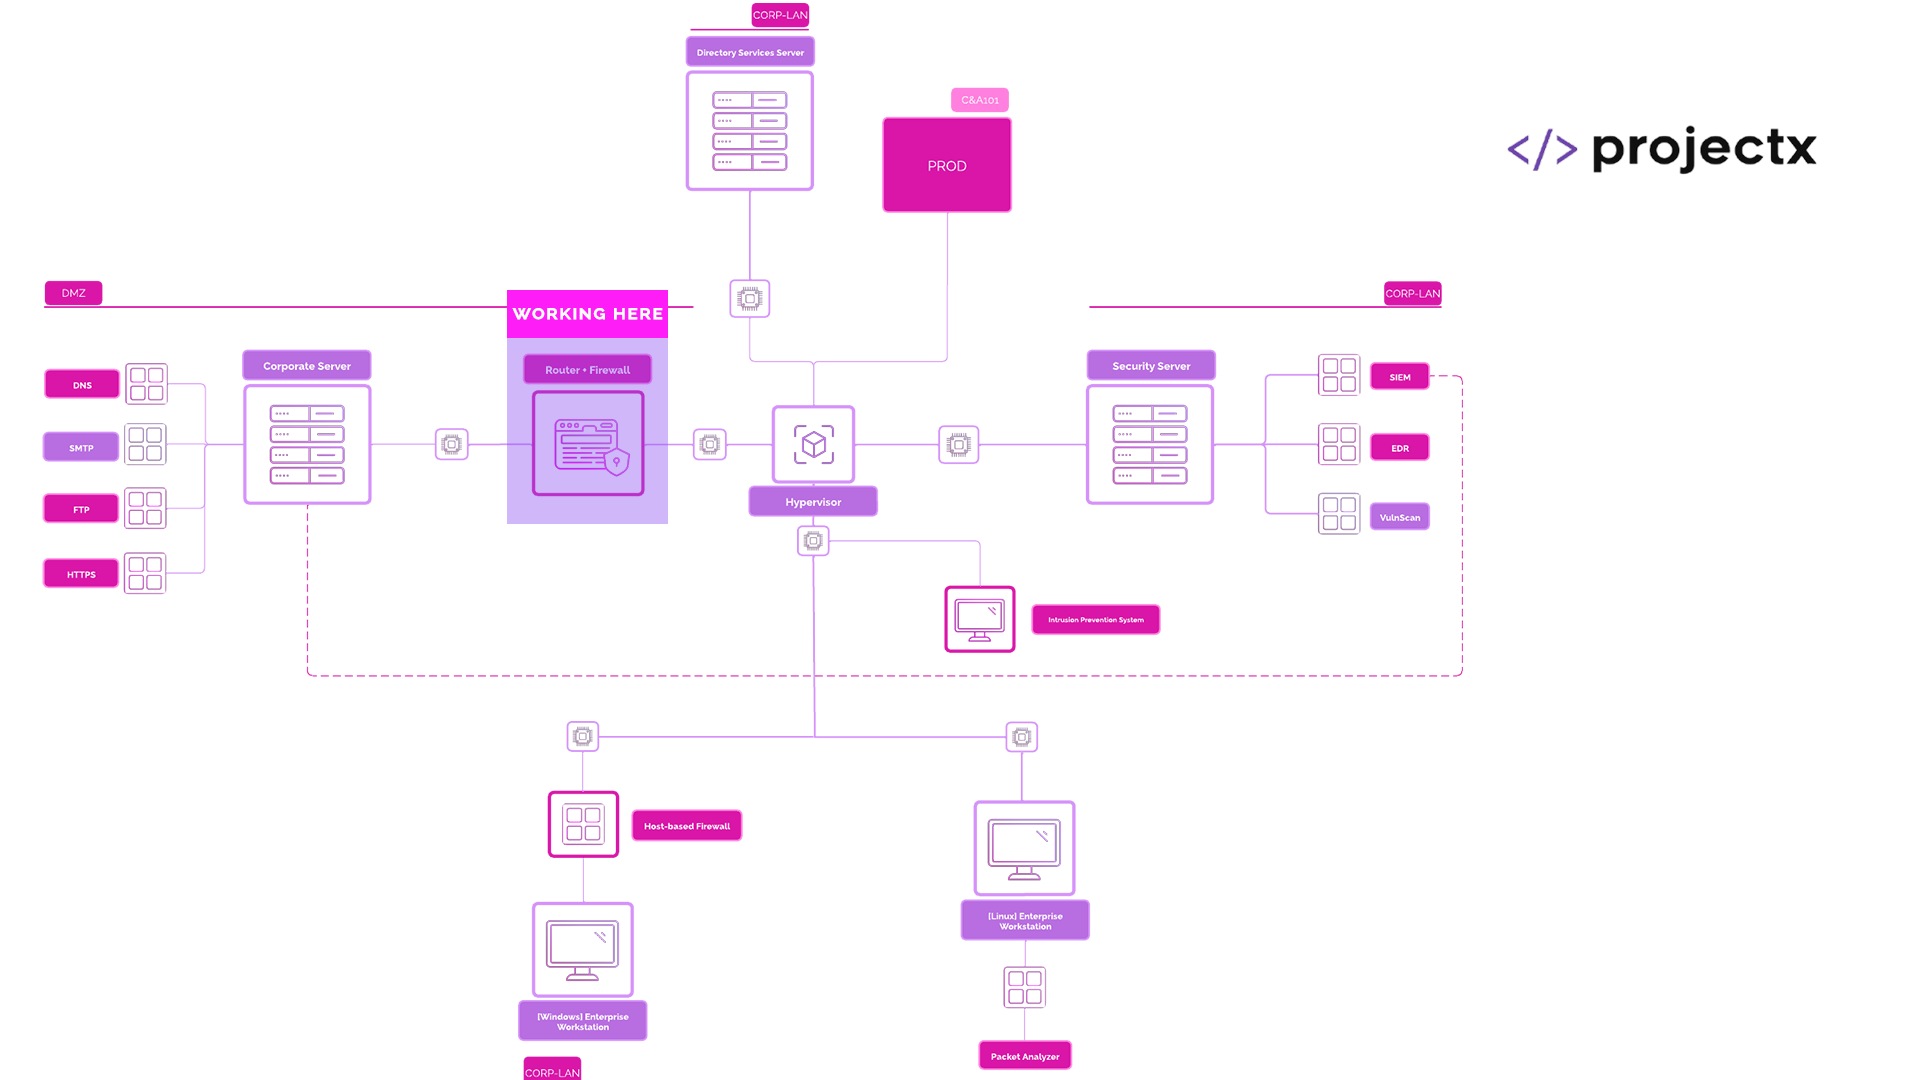
Part 2
Log Ingestion
Logging is imperative to any security function, without it, we would have no idea what is going on. Security log ingestion is the collection, centralization, enrichment, and storing of logs from various system, applications, and network devices into a platform, Wazuh SIEM in our case.
These logs can include authentication attempts, system events, traffic metadata, firewall activity, IDS/IPS Alerts (this is what we are doing!), and more.
Log ingestion is imperative, they can help with many different security functions, including:
-
Threat Detection: Security logs are the first line of defense for identifying suspicious behavior, indicators of compromise (IOCs), and patterns that might signal an attack.
-
Incident Response: When an incident occurs, logs provide forensic data to trace attacker activity, determine impact, and support containment or remediation steps.
-
Compliance: Many regulations (HIPAA, PCI-DSS, NIST, GDPR) require organizations to maintain security logs and monitor them continuously.
-
Auditing: Logs help track who did what and when—crucial for insider threat detection and user behavior analysis.
-
Correlation & Enrichment: Ingested logs can be enriched (e.g., with geolocation or threat intelligence) and correlated with other data sources to build a clearer picture of events across systems.
eve.json & fast.log
Suricata provides many different types of logs that can be used to track, detect, and prevent malicious network activity.
Two of the most essential logs types include eve.json and fast.log.
eve.json
Is Suricata’s main structured log file in JSON format. It's designed for machine parsing and integration with tools like Elasticsearch, Splunk, or SIEM platforms.
eve.json will include all types of events including alerts, protocol level data, fileinfo, packet stats, and network flow.
fast.log
A simple readable log file that includes only alert events in a single-line format. Each line contains the alert's priority, timestamp, signature ID, source/destination IPs, ports, and message.
Both of these can be useful to onboard for security log detections and alerting.
We are going to learn how to do this using our out-of-the-box Suricata solution in [project-x-sec-work] and [project-x-corp-fw] (pfSuricata).
Part 1: Suricata Logs In [project-x-sec-work]
Power on [project-x-sec-work].
Verify [project-x-sec-work] has an IP address in the CORP-LAN subnet (192.168.15.1/24).
ip a
Suricata, by default, appends it's logs to the /var/log/suricata file path.
-
/var/log/suricata/fast.log -
/var/log/suricata/eve.json
Let's add both of these to Wazuh's ossec.conf file to track and ingest into the Wazuh manager.
Navigate to the /var/ossec/etc/ossec.conf file on [project-x-sec-work].
sudo nano /var/ossec/etc/ossec.conf
Search the file with CTRL + W.
Type "localfile".
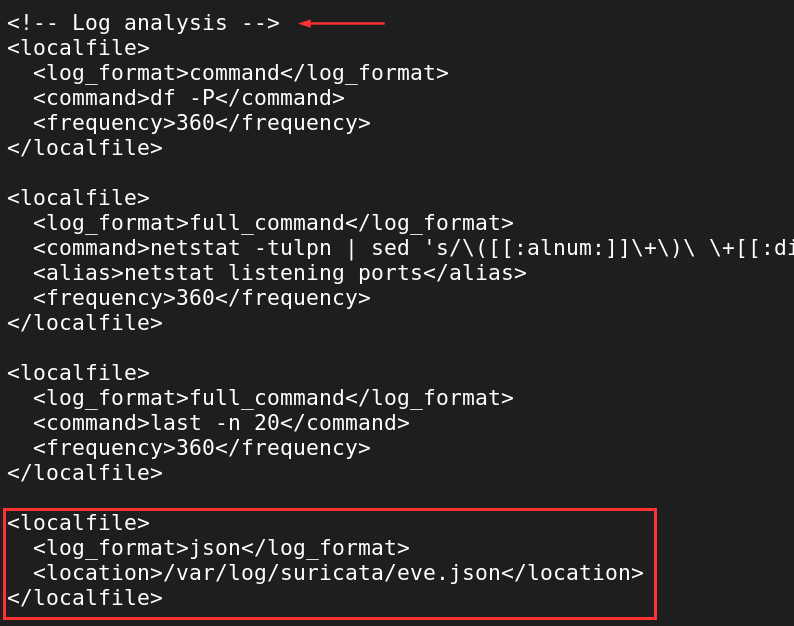
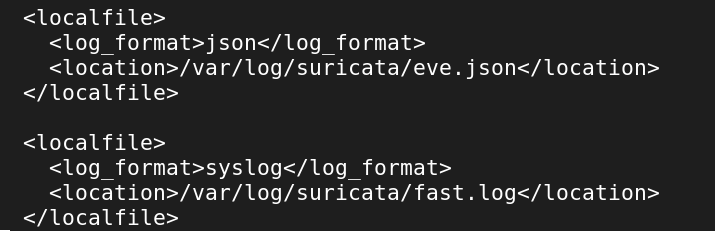
Navigate to the "Log analysis" section, at the bottom, we will add two <localfile> blocks.
  <localfile>
    <log_format>json</log_format>
    <location>/var/log/suricata/eve.json</location>
  </localfile>
  <localfile>
    <log_format>syslog</log_format>
    <location>/var/log/suricata/fast.json</location>
  </localfile>
Exit Nano with CTRL + X, then Y key, Enter Key.
Restart the wazuh-agent to refresh the configuration file.
sudo systemctl restart wazuh-agent

Navigate back to [project-x-sec-box].
Go the the "Discover" tab.
Search "/var/log".
You should start to see logs come in, with its source file location from /var/log/suricata/eve.json.
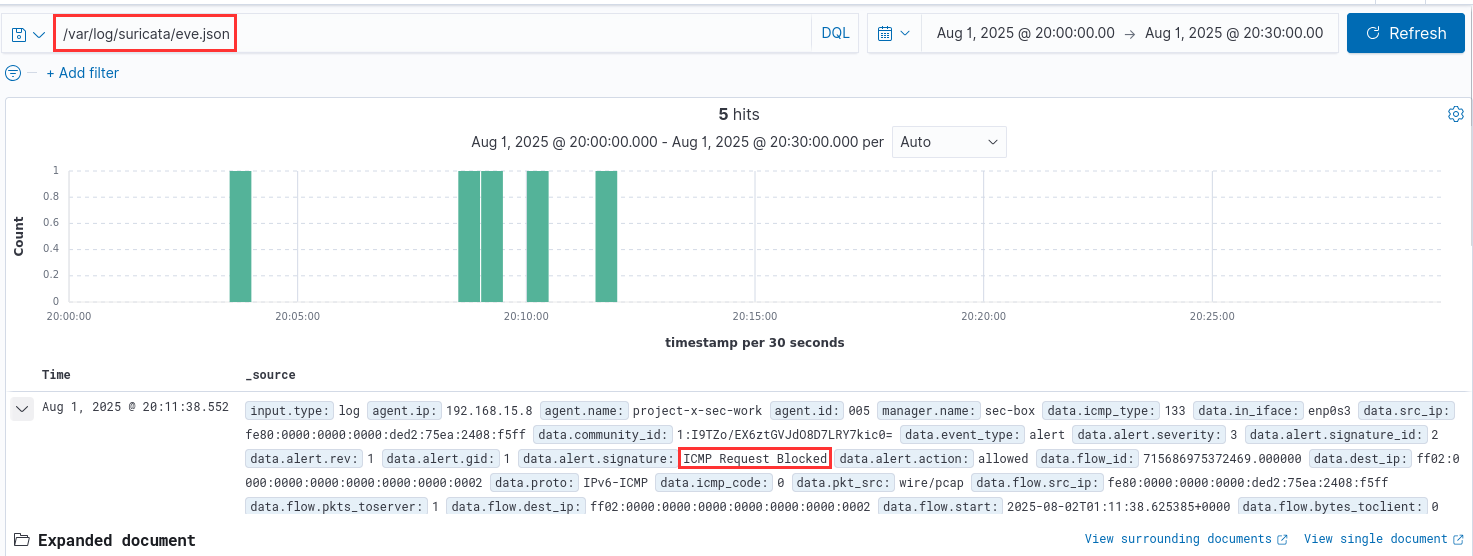
Success!
Part 2: pfSense Logs
Make sure the [project-x-corp-fw] VM is powered on.
We are going to ingest pfSense System, DNS, DHCP, and Firewall logs via Syslog. Wazuh comes with support for all different types of formats and ingestion methods.
Specifically for devices that cannot have an agent installed, Syslog is a good option.
Here's how the log flow will go...
Log is generated --> Goes to pfSense Syslog --> Wazuh Listens on Syslog Port for Incoming Log Messages --> Wazuh Receieves a log --> Wazuh Indexer indexes the log.
For the Syslog port, we will use 5514. The default port configured in pfSense is 514, we will use 5514 since 514 is already used by pfSense for internal syslogs.
Navigate to the IP address: http://192.168.15.2 on your host machine in the browser.
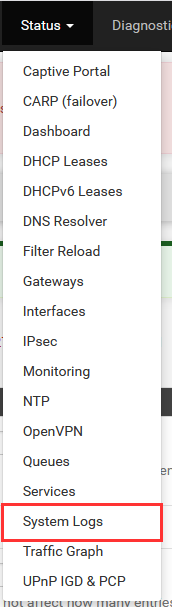
Navigate to to "Status" ➔ "System Logs".
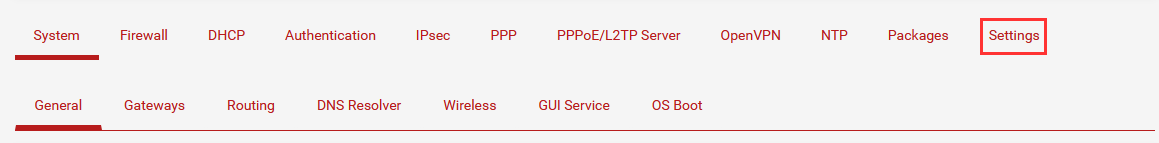
Choose "Settings".
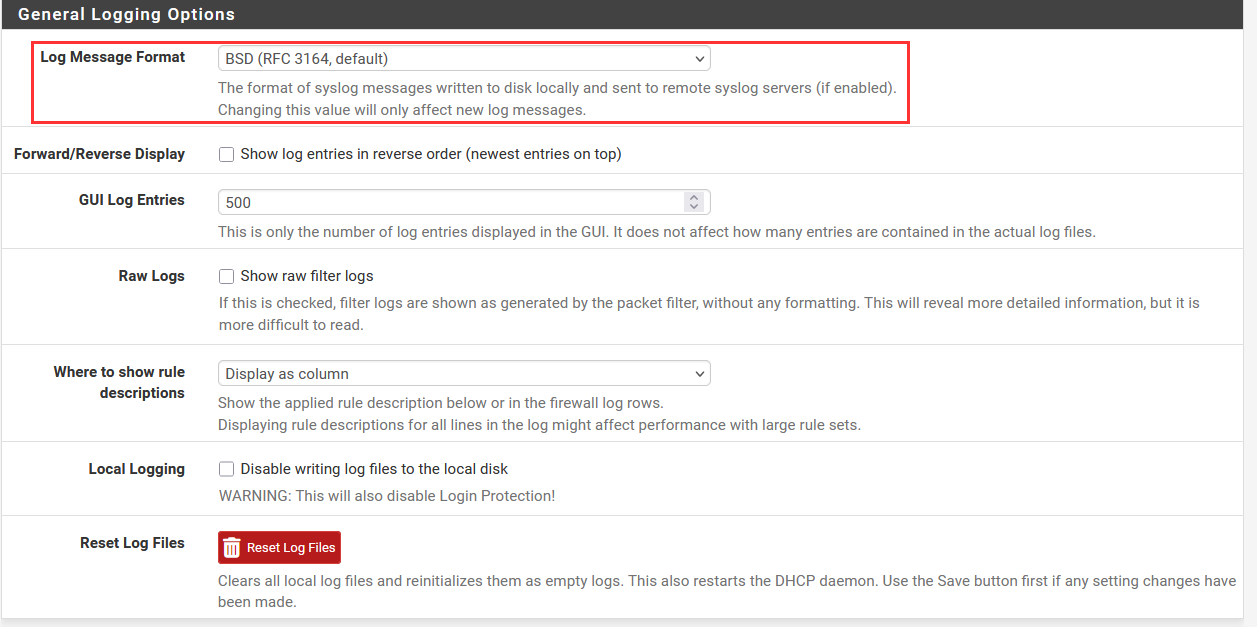
Ensure that "BSD" log format is selected. This is a standard log formatting we can apply to all logs.
Scroll down to the bottom.
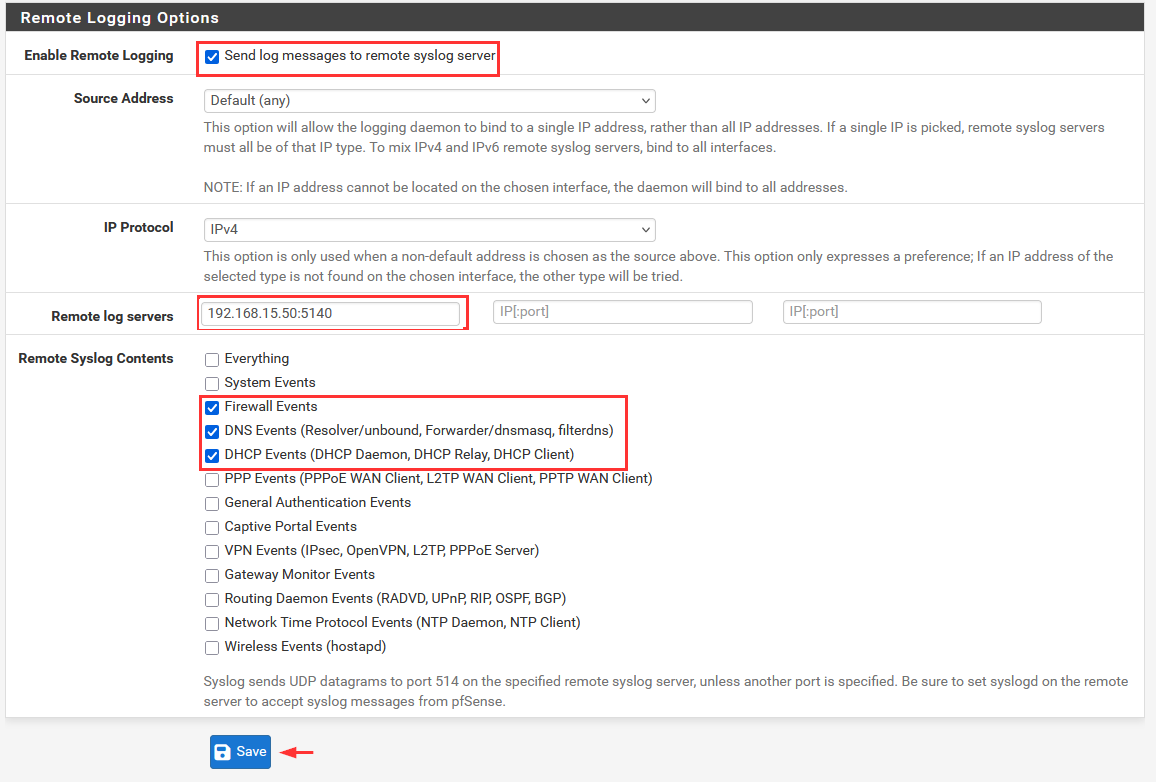
Check the "Send log messages to remote syslog server".
Add in the IP address of the [project-x-sec-box]: 192.168.15.50:5514.
Choose the "System Logs, Firewall Events, DNS Events, DHCP Events".
Save.
Navigate to "System" ➔ "Package Manager" ➔ "Available Packages".
Search for "syslog-ng".
Choose the Install.
Navigate to "Services" ➔ "Syslog-ng".
Choose the following as shown in the screenshot.
👉 You use the CTRL command to select the multiple interfaces of "LAN" and "DMZ".
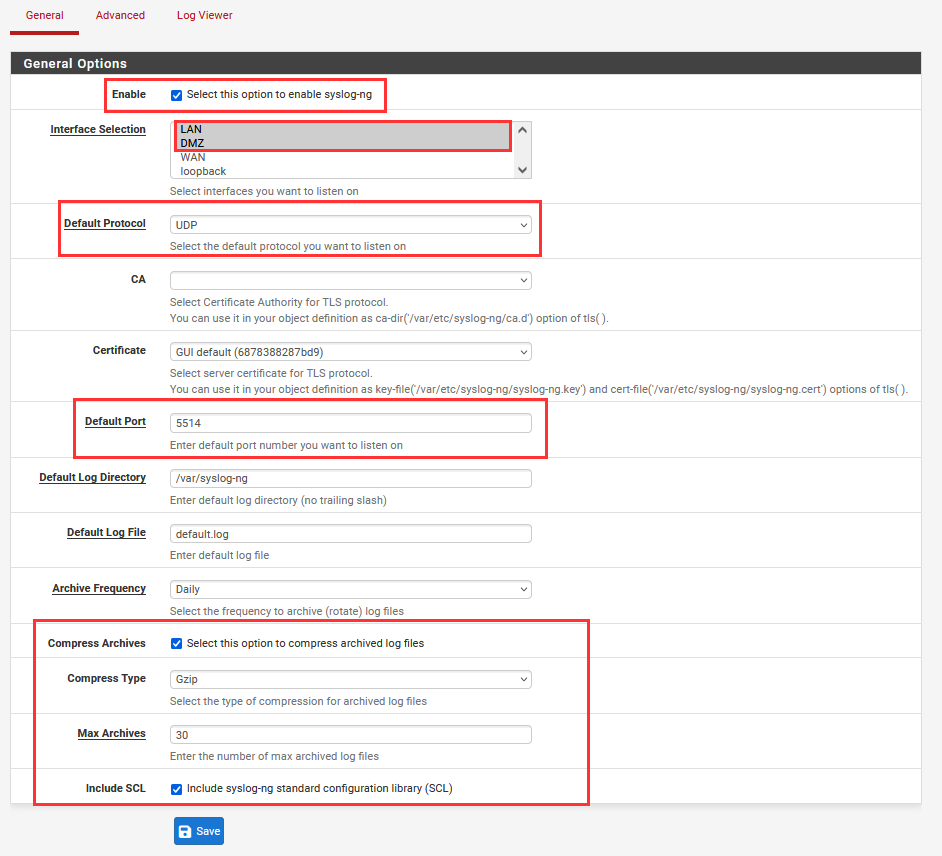
"Save".
Power on and open a new terminal in [project-x-sec-box].
We are now going to add a statement inside ossec.conf (Wazuh's main configuration file) so Wazuh can open a port (5514), protocol (UDP) on [project-x-sec-box]'s IP address of 192.168.15.50. And accept connections from specific hosts, in this case we want to listen for incoming network packets or logs coming from 192.168.15.2 or the [project-x-corp-fw].
sudo nano /var/ossec/etc/ossec.conf
  <remote>
    <connection>syslog</connection>
    <port>5514</port>
    <protocol>udp</protocol>
    <allowed-ips>192.168.15.2</allowed-ips>
    <local_ip>192.168.15.50</local_ip>
  </remote>
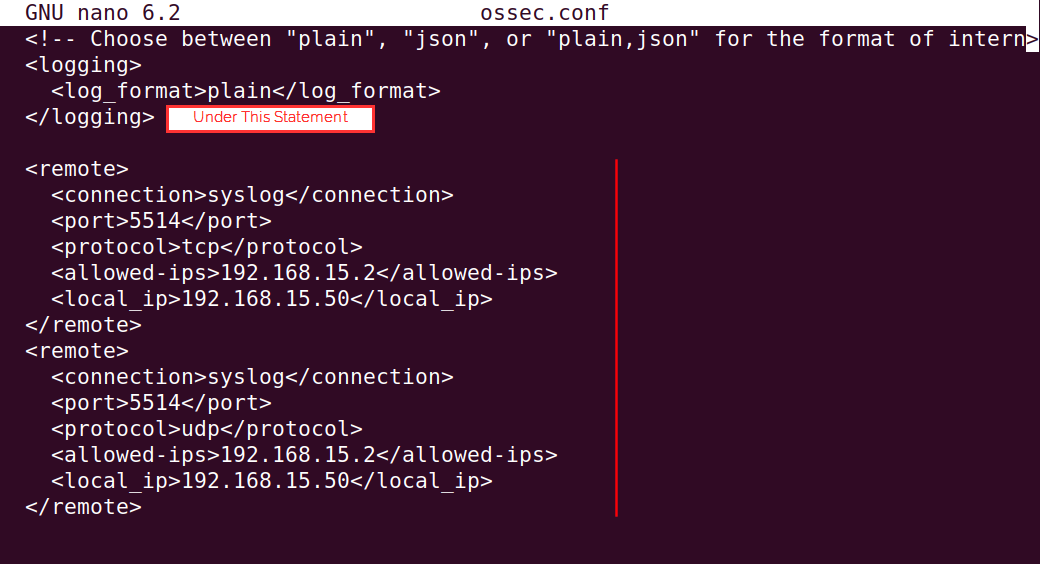
Take note of the identation and where the <remote> block has been added.
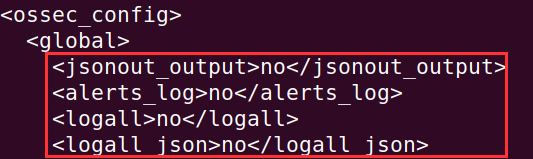
Before we exit out of ossec.conf. Go all the way up to the top to the <ossec_config> block. We are going to enable a few options here.\
Change all of the "no" to "yes" in the highlighted boxes.
What we are configuring here is to log every message. These messages will get logged to the /var/ossec/logs/archives/archives.log, a "catch-all" log file that Wazuh will use. We want to enable these to ensure messages are coming in from [project-x-corp-fw]. After this, we can revert these back to "no", as this will take up a lot of disk space.
Restart Wazuh to apply changes from the ossec.conf file that we have changed.
sudo systemctl restart wazuh-manager.
Since we are opening a custom port of 5514, where Wazuh will set a listener up to recieve syslog messages, we need to enable firewall access for 5514/udp.
Allow the following ports with ufw.
sudo ufw allow 5514/udp
Finally, go back into the [project-x-corp-fw] ➔ "Firewall" ➔ "Rules".
Ensure that the following firewall rules are applied to LAN and DMZ networks, you will have to create the same rule, twice.
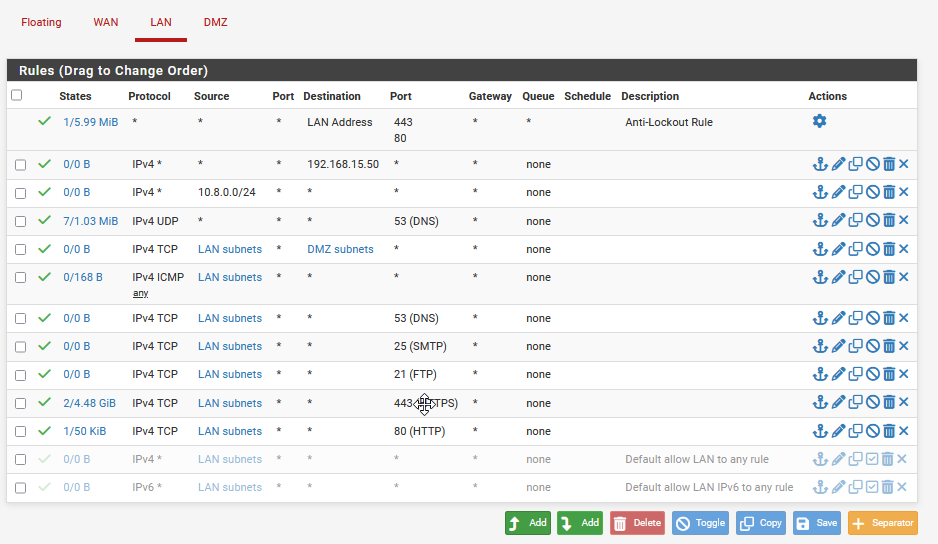
You can start to see logs from the pfSense IP address come into the archives.log.
tail -f /var/ossec/logs/archives/archives.log | grep 192.168.15.2

To trigger a log that will be ingested into Wazuh, let's simulate a failed login attempt.
Log out of pfSense.
Log back in with a bad password.

Go the the "Discover" tab.
You will see a new log with under "syslog" with "authentication_failed".
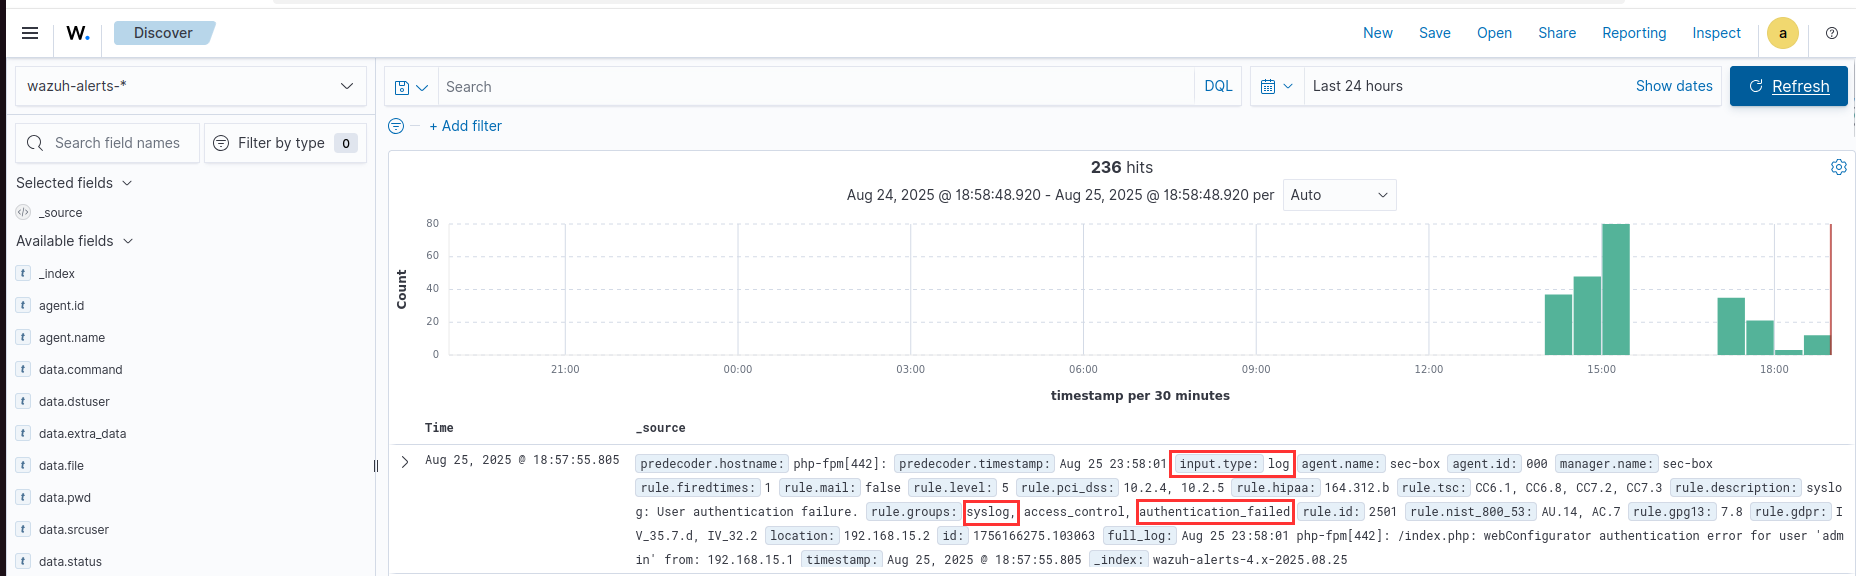
Success!
Go back to the ossec.conf.
sudo nano /var/ossec/etc/ossec.conf
Make sure to comment the selected log all options from "yes", to "no".
We would rather not wake up to a system error or blue screen of death because we maxed out our disk space. (Looking at you Crowdstrike.) (If you know, you know.)