SIEM - Setup Wazuh
Prerequisites
- VirtualBox or VMware Workstation Pro installed.
- Virtual Machine
[project-x-security-svr]has been provisioned, configured, and fully setup. - Virtual Machines Installed & Configured:
[project-x-win-client][project-x-linux-client][project-x-sec-work]
- Windows Server 2025 with Active Directory Domain Services (ADDS) configured and running in the background.
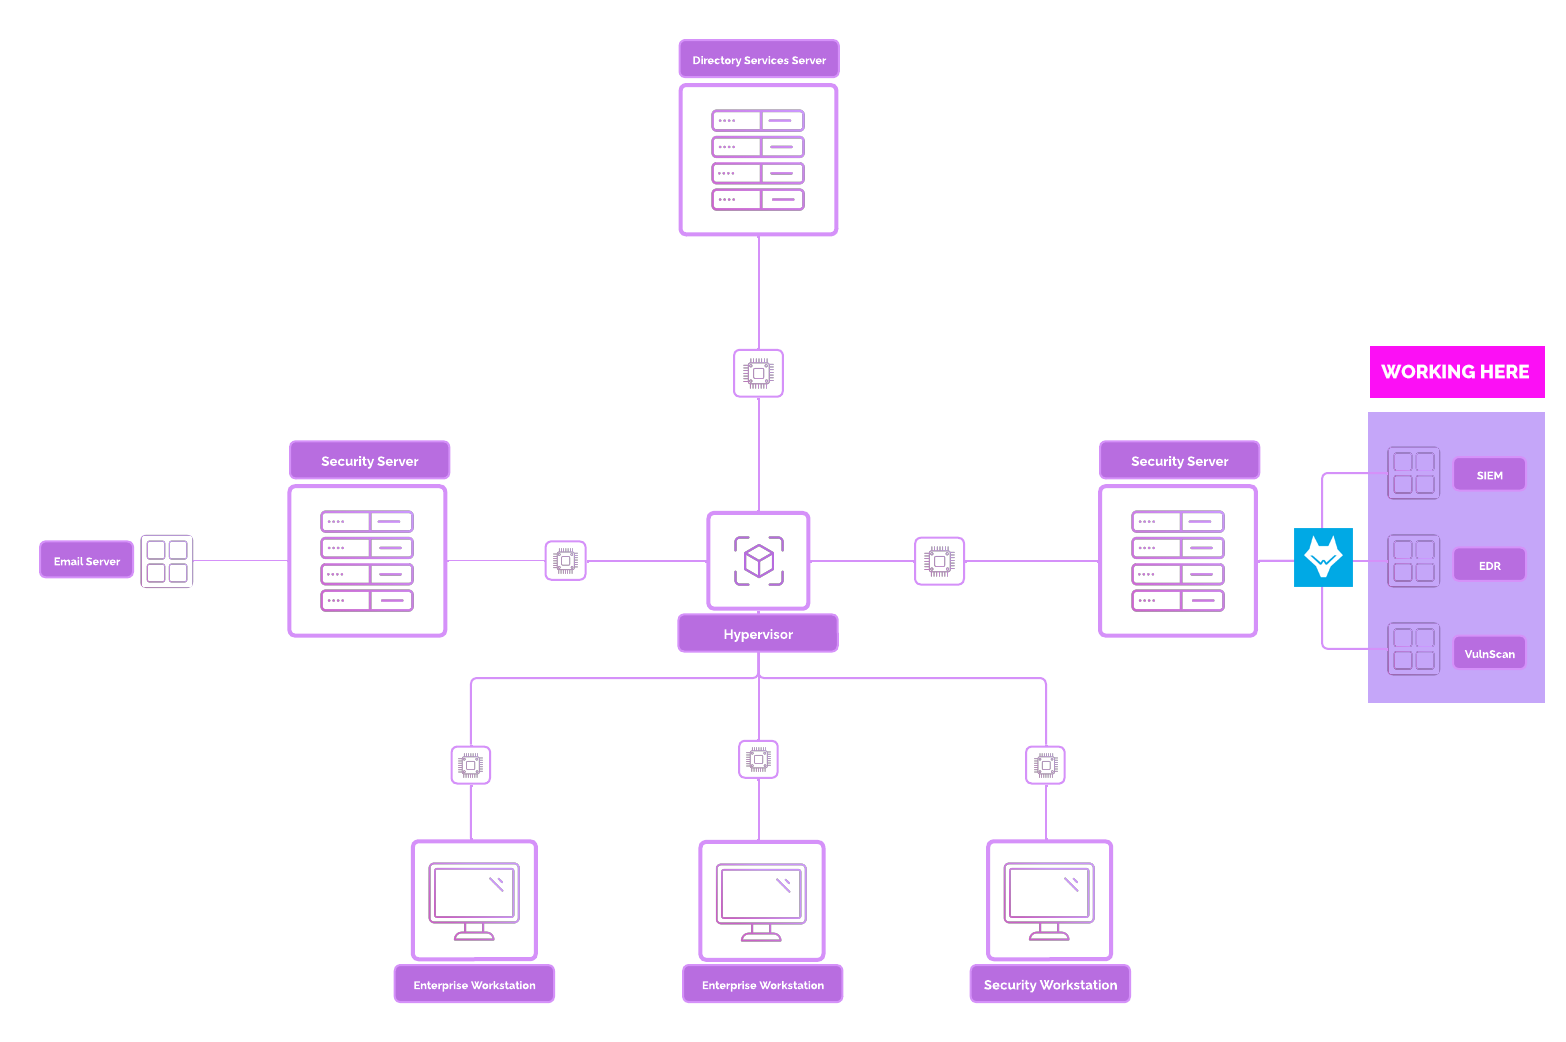
Network Topology
Wazuh Overview
Wazuh is an open-source platform that provides extended detection response (XDR) and System Information and Event Management (SIEM) to protect cloud, container, and server workloads.
Wazuh comes with an array of capabilities including log data analytics, intrusion and malware detection, file integrity monitoring (FIM), configuration assessment, vulnerability detection, and support for regulatory compliance.
-
Extended Detection Response (XDR): XDR is a defensive approach that integrates data and insights from multiple security layers. Data is collected and aggregated into a unified platform from data sources such as workstations, servers, cloud environments, and network traffic. XDR provides improved detection, investigation, and response to threats by centralizing all data to identify patterns, trends, and analyze malicious activity. In the context of Wazuh, there are many capabilities and features which enable XDR including multi-source data collection, threat detection, intrusion detection, incident investigation, and file integrity monitoring (FIM).
-
System Information and Event Management (SIEM): Refers to a system that combines log management, threat detection, and incident response to help organizations monitor and secure their IT environments. Wazuh acts as a SIEM solution by collecting and analyzing security data from multiple sources, detecting threats in real time, and facilitating efficient incident response.
Wazuh relies on an agent-based ecosystem. Software agents are deployed to workstations, servers, containers, and virtual machines which send data to Wazuh’s server for processing, aggregation, and visualization of security-relevant information.
There are three main components that make up the Wazuh ecosystem (copied from Wazuh’s documentation):
-
Wazuh Indexer: A highly scalable, full-text search and analytics engine. This central component indexes data logs and stores alerts generated by the Wazuh server.
-
Wazuh Server: Analyzes data received from the agents. It processes it through decoders and rules, using threat intelligence to look for well-known indicators of compromise (IOCs). This central component is also used to manage the agents, configuring and upgrading them remotely when necessary.
-
Wazuh Dashboard: Is the web user interface for data visualization and analysis. It includes out-of-the-box dashboards for threat hunting, regulatory compliance, detected vulnerable applications, file integrity monitoring data, configuration assessment results, cloud infrastructure monitoring events, and others. It is also used to manage Wazuh configuration and to monitor its status.
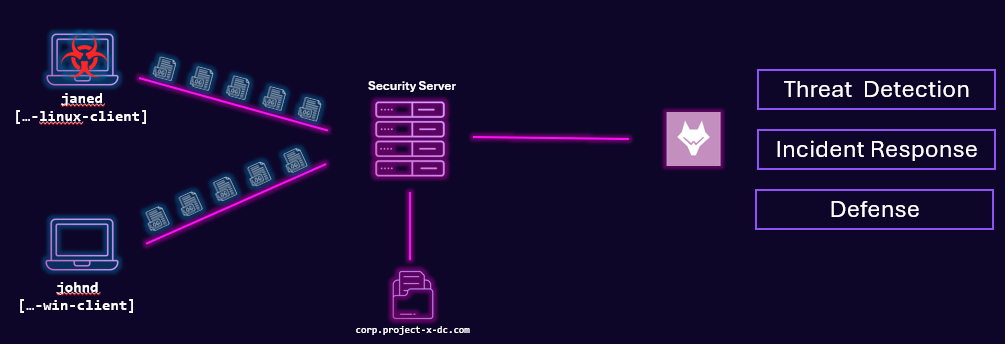
We will use Wazuh as our central hub for security logging, analysis, defense, and remediation while we conduct cyber-attack and defend exercises.
Wazuh provides a solid foundation for gathering relevant data while applying remediations. We will be able to actively view and visualize what happens when attackers are able to achieve initial access, lateral movement, elevation of privileges, persistence, and exfiltration.
As part of this project, we will be configuring Wazuh’s SIEM, XDR, and File Integrity Monitoring (FIM) modules. The Vulnerability Detection module already has a default configuration applied.
In-depth Topology
Wazuh Agent Deployment
In Wazuh, there are two primary ways to manage and configure agents:
- Centralized configuration with a file called
agent.conf. - Local configuration on each agent with a file called
ossec.conf.
Centralized Configuration (agent.conf)
Configuration changes and centralized management are applied to all agents via the Wazuh manager. The agent.conf file is edited on the Wazuh manager to define settings such as log collection rules, configuration changes and active response policies. This is best used for environments with many agents where centralized management is preferred.
Note
This is the configuration style we will use in this guide.
Local Configuration (ossec.conf)
Allows individual agents to have unique configurations. This offers flexibility for agents with specific requirements and is useful when agents are deployed in standalone environments.
The ossec.conf file is manually edited on each agent. Manually editing each agent can lead to configuration drift, where configurations are difficult to manage.
When both configurations are utilized, the local and shared configuration changes are merged. However, the last configuration of any setting is read in the agent.conf file.
The agent.conf file will overwrite any conflicting changes between the two. More can be read here for precedence order.
Security Implications
Running an XDR and SIEM services provides significant advantages to monitor, detect, prevent, and respond to security-related activity. Most mainstream XDR and SIEMs work in a similar fashion, providing similar information. Wazuh is not the only tool or solution offered. There are a lot of tools and vendors in this space (almost too many!).
Since Wazuh is free (♥ to open-source) and provides a suite of capabilities, Wazuh was chosen as the security tool in this lab.
Here are a few security implications or enhancements a SIEM and XDR system provide:
-
Threat Detection
-
Event Correlation: Wazuh analyzes and correlates log data from a wide range of sources (servers, endpoints, network devices) to detect malicious activities such as brute-force attacks, privilege escalation, and suspicious login attempts. This helps in identifying threats across multiple layers of the IT infrastructure.
-
Real-time Alerts: Wazuh generates real-time alerts for malicious behavior, such as unauthorized access, potential malware infections, or network anomalies, enabling immediate response. We are going to configure a few alerts in the Configure a Vulnerable Environment section.
-
-
Proactive Defense
-
Intrusion Detection: Wazuh acts as a host-based intrusion detection system (HIDS), monitoring file integrity, log integrity, and detecting unauthorized changes.
-
Endpoint Visibility: As a part of its XDR functionality, Wazuh collects and analyzes endpoint data to detect advanced threats like fileless malware, lateral movement, and ransomware activities.
-
-
Incident Response and Investigation
-
Automated Responses: Wazuh can be configured to automatically trigger responses (e.g., blocking an IP address or executing scripts to quarantine infected machines), significantly reducing the time between detection and mitigation.
-
Forensics and Data Collection: By storing logs and system data, Wazuh provides critical information for incident investigation. This allows teams to retrace attack steps, identify attack vectors, and determine the scope of the breach.
-
-
Centralized Security Management
-
The UI: Wazuh aggregates data from multiple sources (network, endpoint, and cloud), providing a centralized security management platform. This allows security teams to monitor the health of the entire infrastructure from a single pane of glass, reducing complexity and enhancing situational awareness.
-
Integration with Other Tools: Wazuh integrates with other security technologies such as threat intelligence feeds, vulnerability scanners, and security orchestration tools, creating a cohesive security ecosystem that strengthens overall defense.
-
-
Threat Hunting
-
Behavioral Analysis: With Wazuh’s ability to monitor system behavior, security teams can hunt for signs of advanced persistent threats (APTs), exploits, and other sophisticated attack methods by analyzing anomalies in system and network behavior.
-
Custom Rules and Detection: Wazuh allows the creation of custom detection rules based on unique organizational needs, enabling more targeted threat hunting and response strategies.
-
Note
This guide is based off Wazuh’s official documentation.
Setup Wazuh Indexer + Server
Note
This section is based on Wazuh’s QuickStart Guide documentation. Wazuh recommends a minimum hardware requirement of 4 GB of RAM and 2 CPU cores. If you have the available hardware, feel free to change the RAM and CPU settings in VirtualBox or VMware.
A minimum of 55 GBs of Virtual Disk space is required. Refer to the Project Overview for more information on Virtual Machine specifications.
Sign into sec-user@secbox:
Install cURL if it isn’t installed already:
Issue the following command to start the Wazuh installation wizard:
-i: Ignores minimum system requirements.
Allow the Wazuh Indexer and Server to install, this may take a few minutes. You will know Wazuh was successfully installed when the output shows the access credentials and a message that confirms the installation was successful.
Note
Take note of the Admin password. This will be different for every installation. You can find the passwords for all the Wazuh indexer and API users in the wazuhpasswords.txt file inside the wazuh-install-files.tar. To print them, run the following command: sudo tar -O -xvf wazuh-install-files.tar wazuhinstall-files/wazuh-passwords.txt
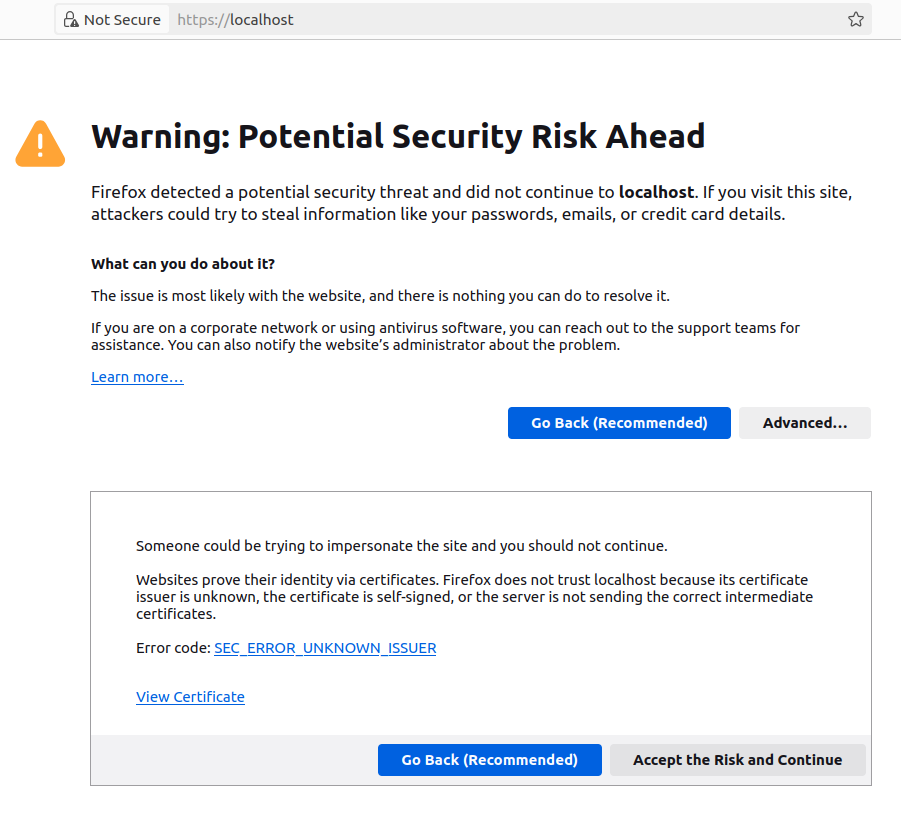
Login into the Wazuh dashboard by entering https://localhost in a new browser tab.
Click “Advanced…” ➔ Accept the Risk and Continue.
Use the credentials generated to log in. Save the password to the browser if you would like.
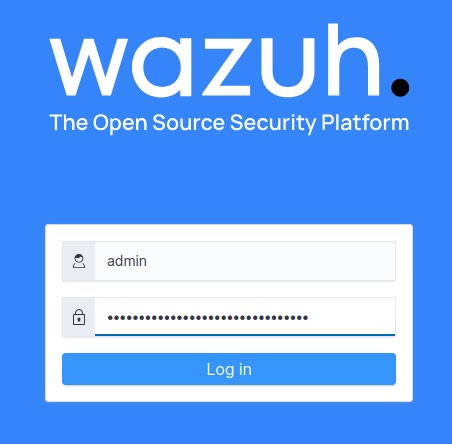
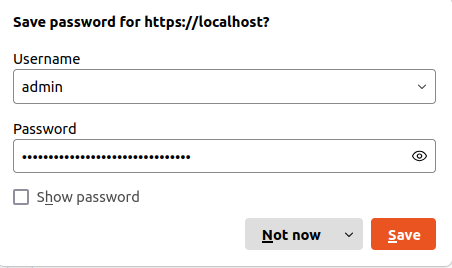
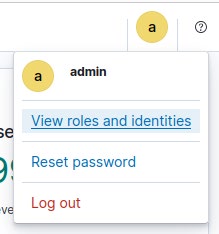
You can also choose to reset the password if you would like something more simple.
Deploy Wazuh Agents
Method 1: Windows [project-x-win-client]
Power on the [project-x-win-client] Virtual Machine.
Login under the “John Doe” account.
Open a new Microsoft Edge Browser.
Copy/Paste the below URL into the URL address in Edge:
- Install the Wazuh Windows Installer (https://packages.wazuh.com/4.x/windows/wazuhagent-4.9.2-1.msi)
An .msi file will start downloading. Wait until it has completed installation.
Double click the .msifile.
Accept the License Agreement ➔ “Install”.
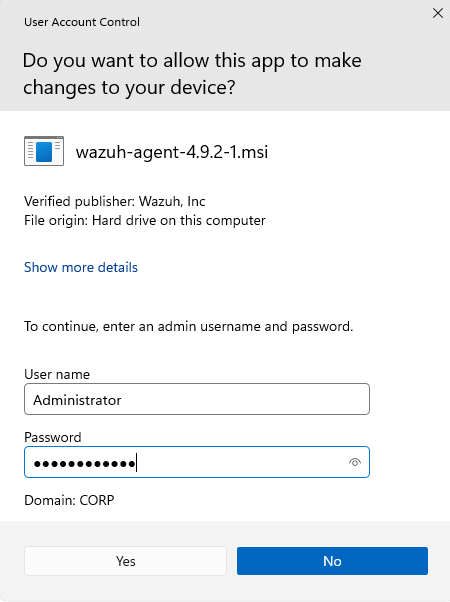
Type in project-x-dc. Administrator’s username and password.
- Password:
@Deeboodah1!.
👉 Refer to the “Project Overview” guide for more information on default usernames and passwords.
Note
If the Administrator’s password has not been set. Go to the [project-x-dc] VM ➔ Tools ➔ Active Directory Users and Computers ➔ Select the Users Folder ➔ Right-click on Administrator ➔ Reset Password. Set password to @Deeboodah1!.
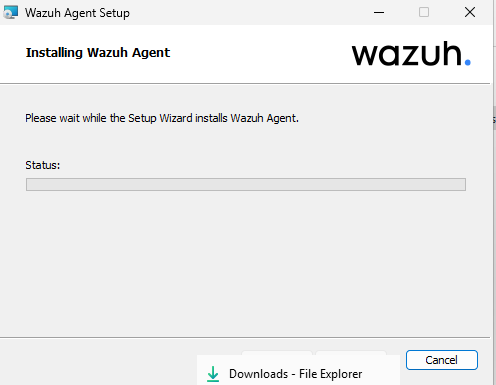
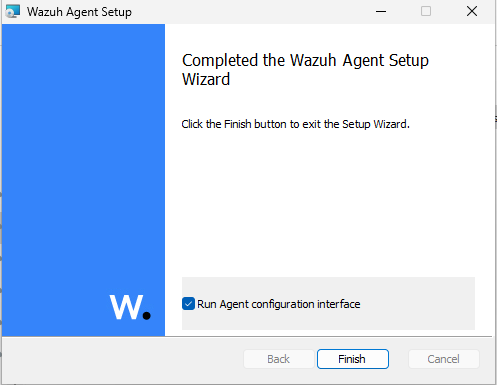
Allow the Wazuh agent to install.
Select the checkbox ➔ Re-enter Administrator Username and password.
Go back to [project-x-sec-box]. Open new “Terminal”.
Escalate to root account:
Type:
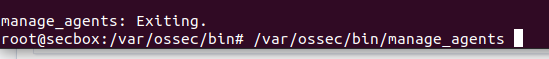
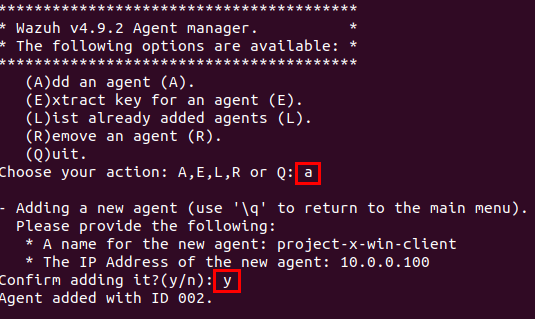
Add new agent with A.
Type in the static IP address for [project-x-win-client].
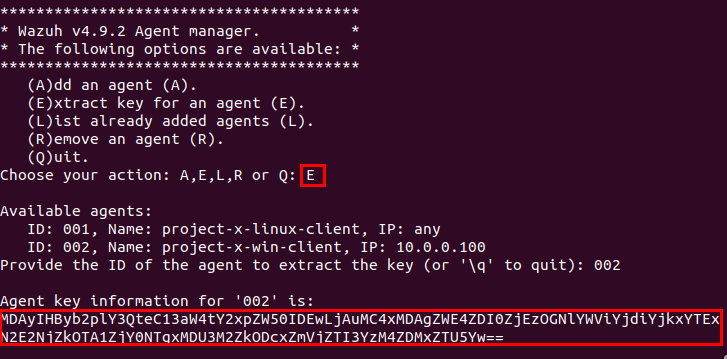
Choose E to view the agent key. Copy this key.
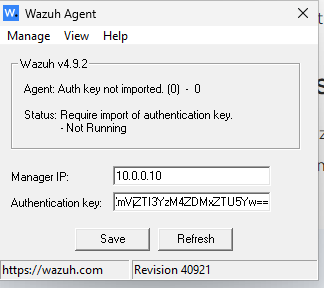
Navigate back to [project-x-win-client].
Add the [project-x-secbox] server’s IP address (10.0.0.10) and the agent authorization key.
Go back to [project-x-win-client] ➔ New PowerShell session as Administrator.
Start the Wazuh Agent:
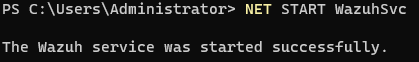
Success!
Method 2: Windows [project-x-win-client]
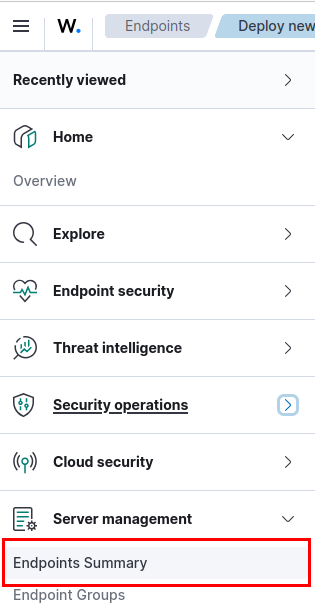
Go to “Server Management” ➔ “Endpoint Summary”.
Choose “Deploy new agent”.
Select Windows MSI.
Server Address: 10.0.0.10.
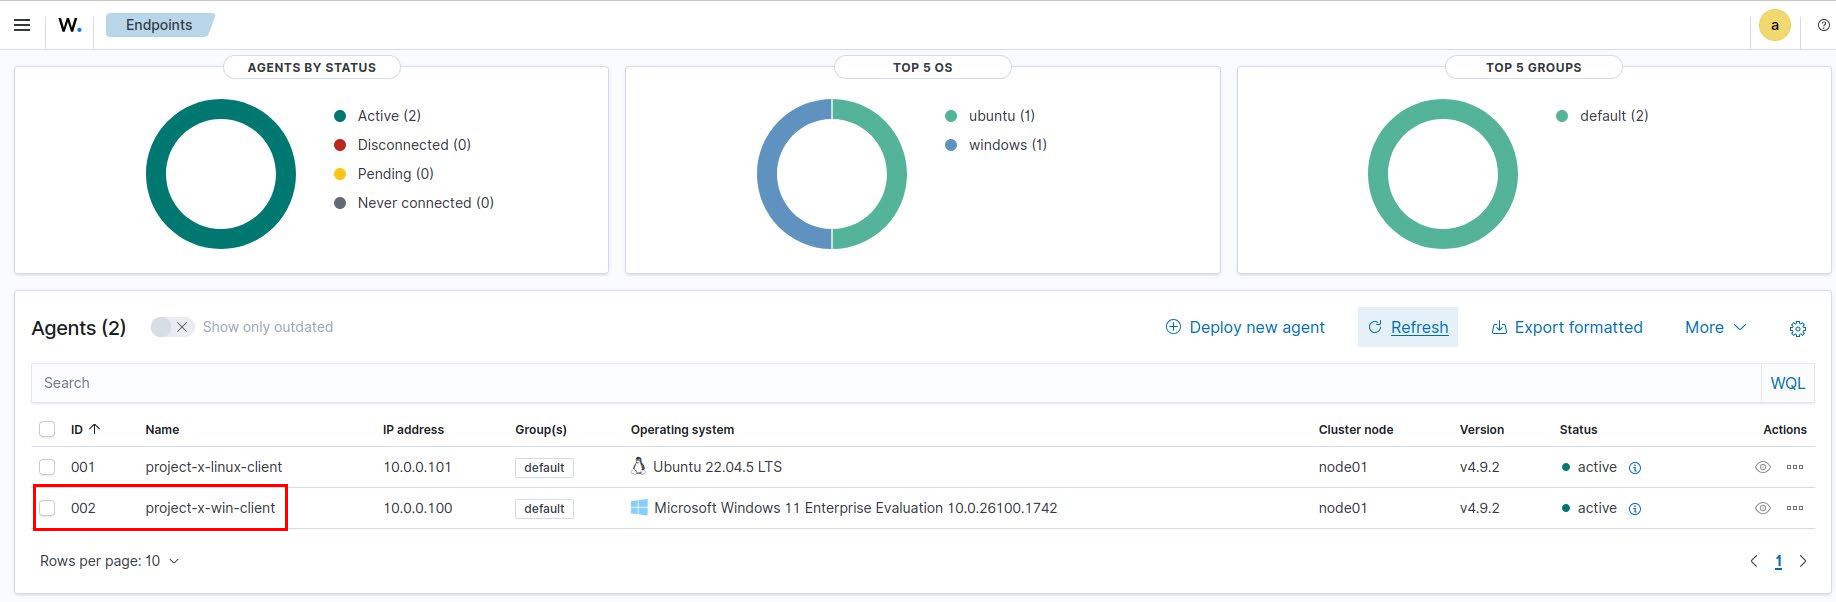
Assign an agent name: project-x-win-client.
Groups: default
Copy the command in step 4.
Power on the [project-x-win-client] Virtual Machine.
Login under the “John Doe” account.
Open new Powershell Session ➔ Right-click “Run as Administrator”.
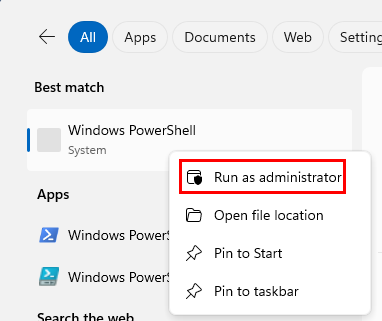
Right-click to paste the command, then run the command:
Invoke-WebRequest -Uri
https://packages.wazuh.com/4.x/windows/wazuh-agent-4.9.2-1.msi -
OutFile $env:tmp\wazuh-agent; msiexec.exe /i $env:tmp\wazuh-agent
/q WAZUH_MANAGER='10.0.0.10' WAZUH_AGENT_GROUP='default'
WAZUH_AGENT_NAME='project-x-win-client'
Domain Controller [project-x-dc]
Repeat the above steps from Method 2 to install onto project-x-dc.
For the WAZUH_AGENT_NAME, change to project-x-dc.
Invoke-WebRequest -Uri
https://packages.wazuh.com/4.x/windows/wazuh-agent-4.9.2-1.msi -
OutFile $env:tmp\wazuh-agent; msiexec.exe /i $env:tmp\wazuh-agent
/q WAZUH_MANAGER='10.0.0.10' WAZUH_AGENT_GROUP='default'
WAZUH_AGENT_NAME='project-x-dc'
Linux [project-x-linux-client]
Go to “Server Management” ➔ “Endpoint Summary”.
Choose “Deploy new agent”.

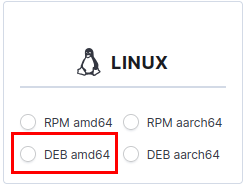
Select DEB amd64.
Server Address: 10.0.0.10.
Assign an agent name: project-x-linux-client
Groups: default
Copy the command in step 4.
Power on the [project-x-win-client] Virtual Machine.
Login under the “Administrator” account.
Open a new terminal ➔ enter the command copied from step 4.
sudo wget https://packages.wazuh.com/4.x/apt/pool/main/w/wazuhagent/wazuh-agent_4.9.2-1_amd64.deb && sudo
WAZUH_MANAGER='10.0.0.10' WAZUH_AGENT_GROUP='default'
WAZUH_AGENT_NAME='project-x-linux-client' dpkg -i ./wazuhagent_4.9.2-1_amd64.deb
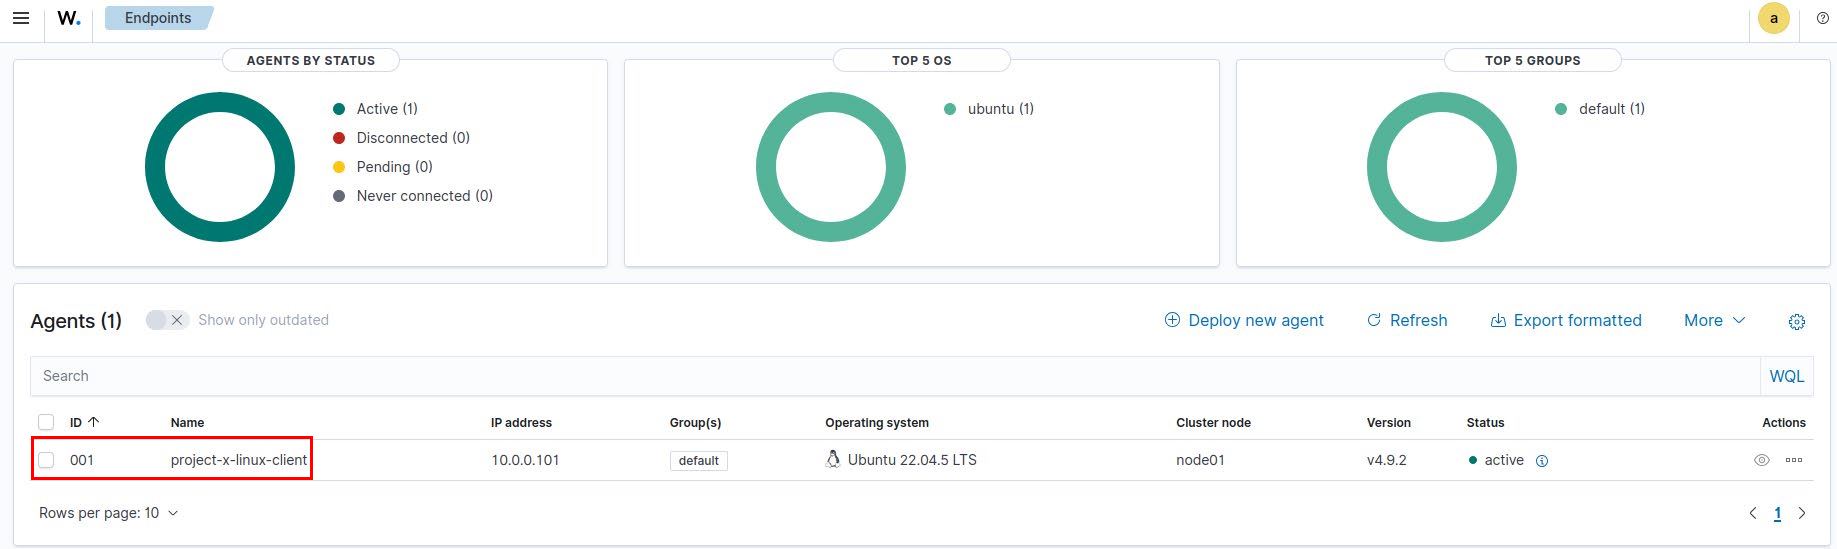
Enter in the following systemctl commands:
Success!
Create Agent Groups
Agent Groups will allow us to logically organize our workstation fleet into separate containers based on what we want.
Let’s create two groups based on the operating system type.
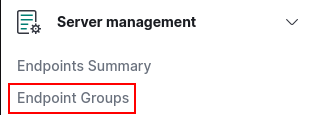
Navigate to “Server management” ➔ “Endpoint Groups”.
Select “Add new group” ➔ Name the group “Linux”.
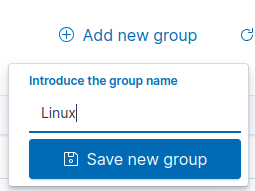
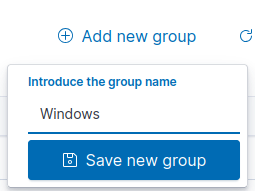
Repeat the same steps for Windows.
Navigate to “Server management” ➔ “Endpoint Summary”.
Select [project-x-dc] agent.
Select the triple dot icon ➔ “Edit groups”.
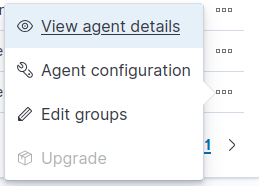
Select the “Windows” group.
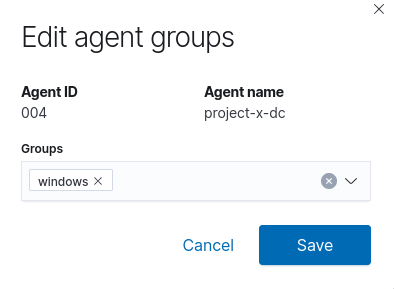
Repeat the same steps for [project-x-win-client] and [project-x-linux-client].
Add [project-x-linux-client] Linux client to a new group called Linux group.
Onboard Custom Logs
Wazuh offers a variety of default logs that are automatically ingested into the Wazuh indexer. This is a great place to start.
Based on our upcoming Attack/Defend scenario, we aim to expand the types of logs collected by both Linux and Windows agents to gather a more comprehensive dataset of log activity.
Let’s edit the agent.conf file located in the Linux and Windows Wazuh groups. Configuration statements (XML declarations) will apply to all endpoints in the group.
Windows Group
Navigate to “Server management” ➔ “Endpoint Groups” ➔ Select the Pencil Icon next to the Windows Group. The agent.conf editor will appear.

Add the following to the empty agent.conf file, then select “Save”.
<agent_config>
 <!-- Shared agent configuration here -->
 <localfile>
 <location>Security</location>
 <log_format>eventchannel</log_format>
 </localfile>
 <localfile>
 <location>Application</location>
 <log_format>eventchannel</log_format>
 </localfile>
</agent_config>
Here we are onboarding the Windows Security and Application Event logs. These are default log sources used to collect host-based activity.
Linux Group
Navigate to “Server management” ➔ “Endpoint Groups” ➔ Select the Pencil Icon next to the Linux Group.
Add the following to the agent.conf file, then select “Save”.
<agent_config>
 <localfile>
 <log_format>syslog</log_format>
 <location>/var/log/auth.log</location>
 </localfile>
 <localfile>
 <log_format>syslog</log_format>
 <location>/var/log/secure</location>
 </localfile>
 <localfile>
 <log_format>audit</log_format>
 <location>/var/log/audit/audit.log</location>
 </localfile>
</agent_config>
- Here we are onboarding
/var/log/auth.log/var/log/secureand/var/log/audit/audit.log. These are log sources that can be used to collect host-based activity
📸 Take Snapshot
Note
There will be additional configurations being made during the “Attack Scenario” sections.