Configure a Vulnerable Environment
Prerequisites
- Baseline
project-x-networkhas been provisioned and configured. - All Guides Under "Deploy VMs + Services" and "Tools" have been completed.
Network Topology
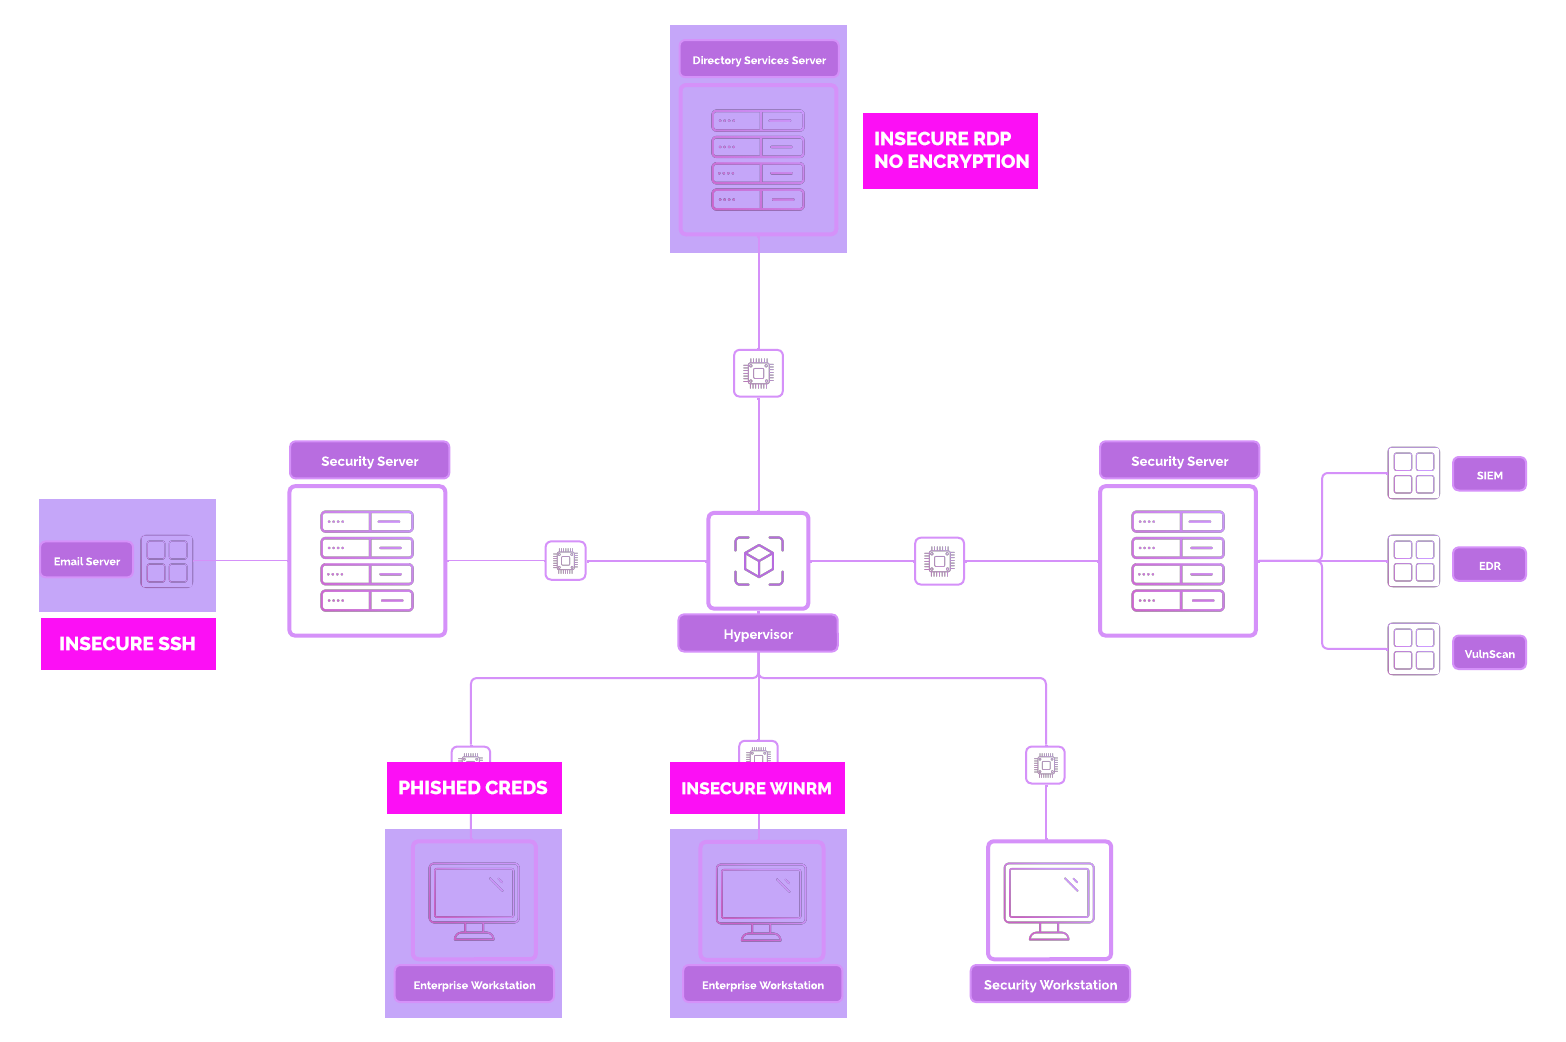
Vulnerable Environment
Overview
In this guide, we are going to perform configuration changes to make our environment ‘vulnerable’.
Depending on the size, scale, and complexity of a business network, attackers will often leverage insecure and default configurations to their advantage.
Even though these configurations appear to be obviously insecure, you will still see some of these in production environments.
Often times, this is due to legacy systems, forgotten infrastructure, urgency, or laziness (that one would be me).
Danger
These configurations are intended for homelab use only and should not be applied in production environments. Projectsecurity.io assumes no responsibility for any communication or actions taken based on this material.
Note
Please make sure the Setup Wazuh Section has been completed in addition to all other guides outlined in the Prerequisites,
Open SSH on [project-x-corp-svr]
Update system and install openssh if it is not yet installed (should already be installed).
Enable the SSH Server and ensure it runs on boot.
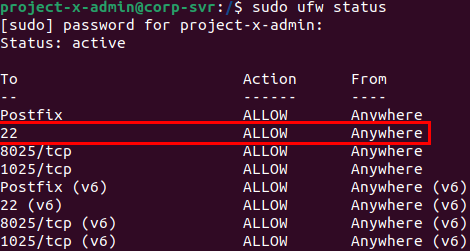
Change UFW rules to allow SSH connections:
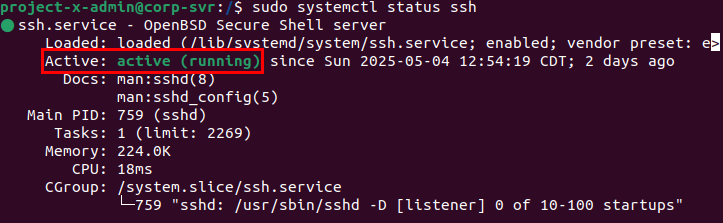
Verify SSH is running:
Let's change a few settings for this SSH configuration.
Open the SSH configuration file:
Use arrow keys to scroll up and down.
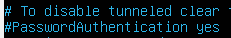
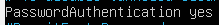
Locate the line for PasswordAuthentication. Uncomment if commented.
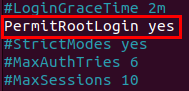
Next, permit root login.
Navigate to the #PermitRootLogin block. Uncomment and delete prohibit-password statement, change to yes.
Restart SSH service:
Set root’s password.
* Set password: november
🚨 Detection Integration
[project-x-corp-svr] does not have the Wazuh agent installed. This is intentional to demonstrate how the absence of detection controls can create a gap in identifying potentially malicious activity.
Open SSH on [project-x-linux-client]
Update system and install openssh if it is not yet installed (should already be installed)
Enable the SSH Server and ensure it runs on boot.
Change UFW rules to allow SSH connections:
Verify SSH is running:
Enable Password Authentication. Open the SSH configuration file:
Locate the line for PasswordAuthentication. Uncomment if commented.
Restart SSH service:
Set root’s password (use the password: november)
🚨 Detection Integration
Wazuh has a built-in rule detection to detect authentication failures from the sshd daemon.
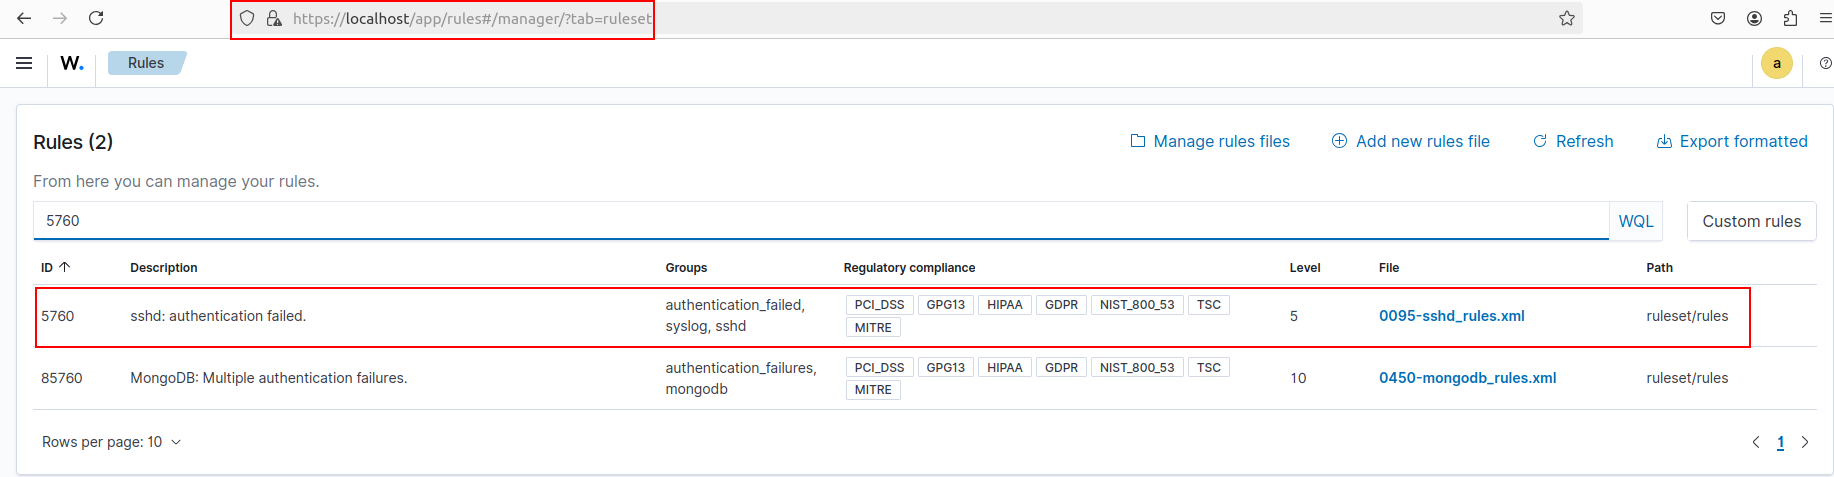
- Wazuh Rule ID:
5760. - Description:
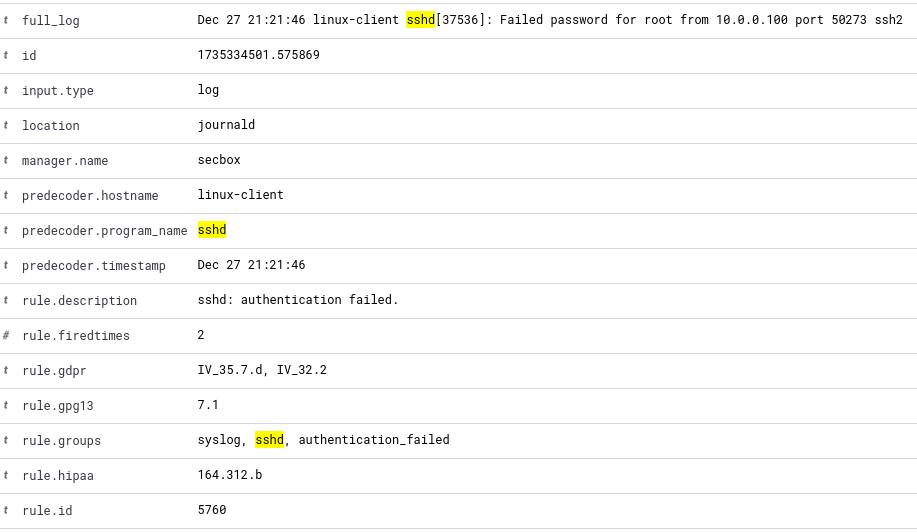
sshd: authentication failed.
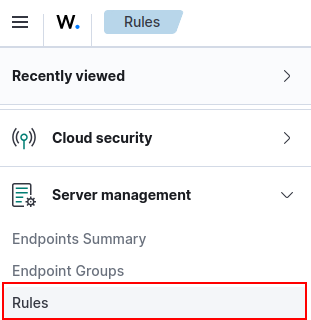
Navigate to “Server management” ➔ “Rules”. And look up “5760” to view more detail about this rule.
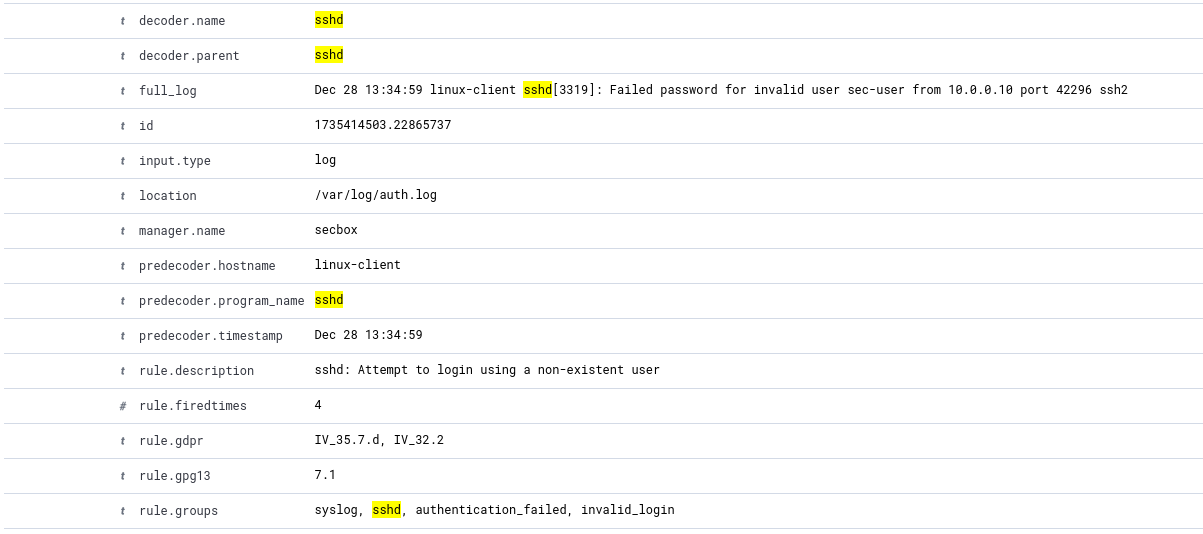
Here is a sample snapshot of a log generated when the SSH attempt fails.
Go to “Explore” ➔ “Discover” tab. Look up “sshd”.
- 💡 You must have a failed login attempt.
🚨 Create Detection Alert
Let’s create an alert for Failed SSH attempts. To do this, a Monitor will be set up to analyze logs. Based on certain conditions defined, a Trigger can be setup to open an Alert.
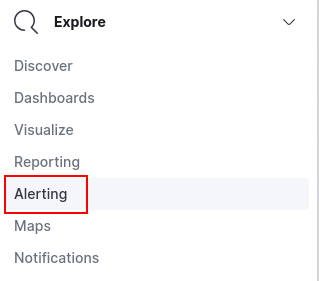
Go to “Explore” ➔ “Alerting”.
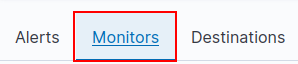
Select the “Monitors” tab on the top left.
Select “Create monitor”.

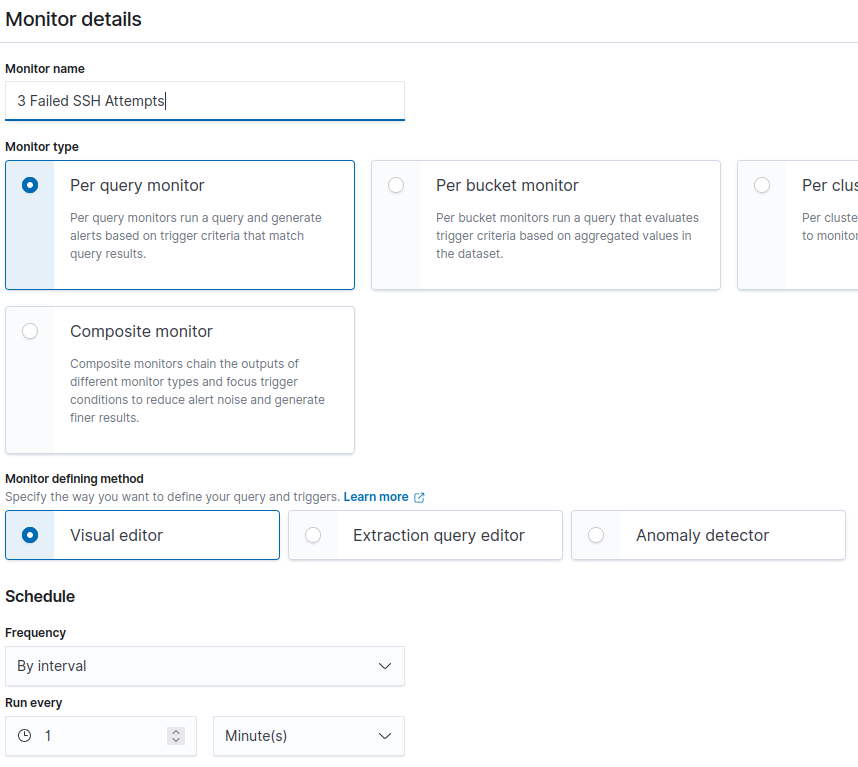
Here we can create a new monitor.
Title the Monitor “3 Failed SSH Attempts”. Leave everything else default.
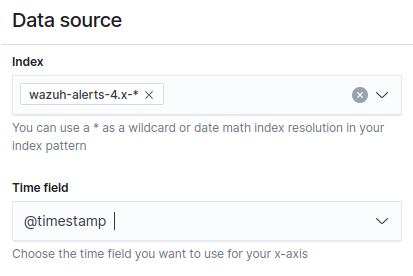
Scroll down to “Data source”. Add the following for the Index, hit the Enter key after typing: wazuh-alerts-4.x-*
For “Time Field” select: @timestamp
Next, we can add a query to select what logs and log fields we would like to monitor.
Based on a sample log of a failed ssh attempt, we can construct a query to monitor specific field or value key pairs.
Note
Where would you get sample logs?: We can populate sample logs by emulating the behavior (failing SSH attempts) and having our Wazuh agent send the logs. We can also use open-source rules or log samples to generate logs.
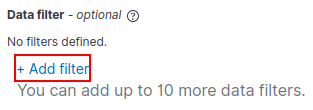
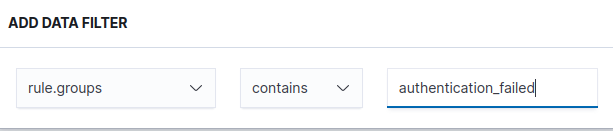
Navigate to the “Data filter” ➔ “+ Add filter”
Based on the above sample log, let’s craft a query to select based on the “sshd” process name and the “authentication_failed” rule group.
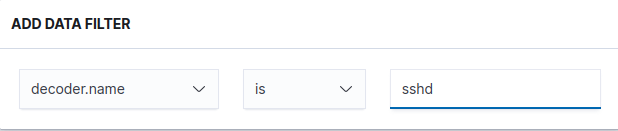
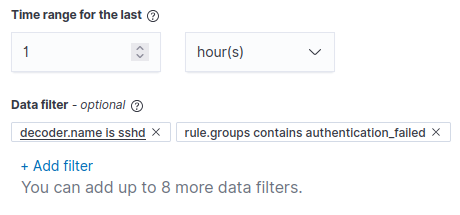
Your “Data filter” tab should now look something like this.
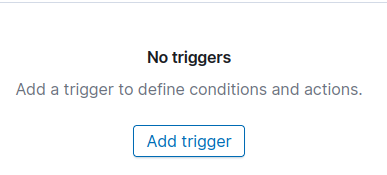
Let’s add a Trigger.
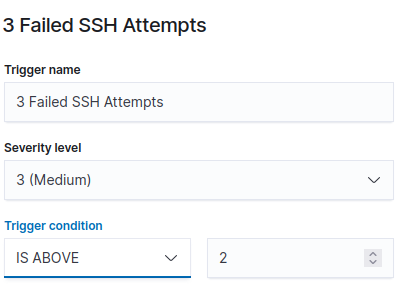
Add the following conditions to the Trigger. We set the “Severity level” to 3 (Medium) and the “Trigger condition” above 2.
So what we are doing here… Once we get more than 2 logs that have met the following query conditions from above, an alert will be generated.
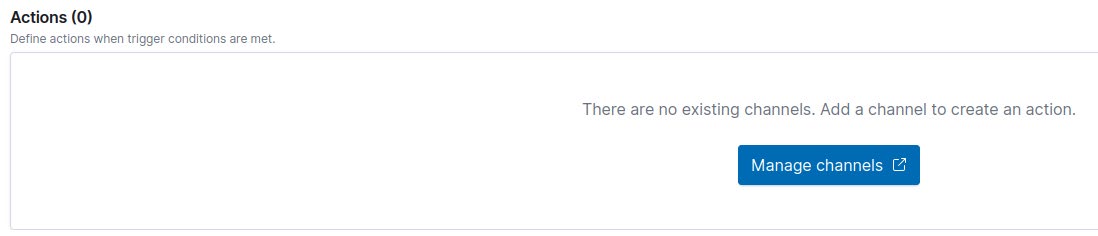
There’s also an “Actions” option. Here we could create an Email, Slack, or Microsoft Teams notification of the alert. We could also launch a playbook that would follow a specific instruction set to analyze, investigate, or isolate a host. We are not going to configure this section. (We will in future Core Sections of ProjectSecurity).
Scroll to the bottom and Select “Create”.

Configure SMTP Email Inbox Connection from [project-x-corp-svr] to [project-x-linux-client]
We are currently using MailHog to simulate an SMTP email inbox.
Note
We have already completed these steps in the Email Server - MailHog section.
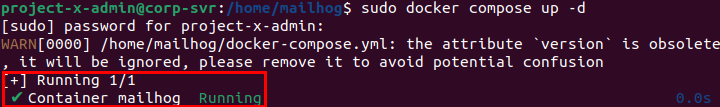
Ensure the MailHog container is running in [project-x-corp-svr].
Run the container with sudo docker compose up -d.
- -d: Runs in detached mode.
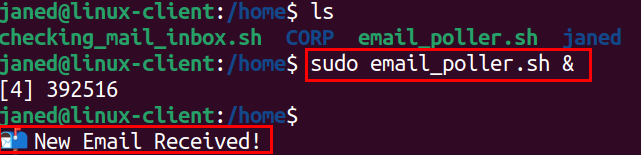
On the [project-x-linux-client] host, let's ensure we have and can run the email_poller.sh script.
- 💡 If you do not have the
email_poller.shscript, refer to the Email Server - MailHog guide.
Go to the home directory: cd /home.
We can run this script in the background with: ./email_poller.sh &.
- Stop the script if needed with:
pkill -f email_poller
🚨 Detection Integration
[project-x-corp-svr] does not have the Wazuh agent installed. This is intentional to demonstrate how the absence of detection controls can create a gap in identifying potentially malicious activity.
Enable WinRM on [project-x-win-client]
Log into [project-x-win-client], open a new Administrator Powershell session.
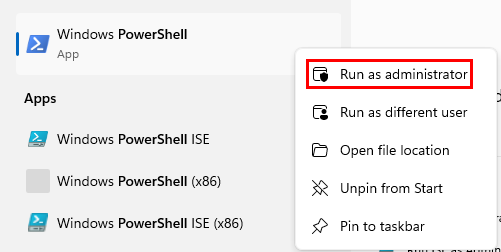
Type the following commands to enable WinRM.
powershell -ep bypass
Enable-PSRemoting -force
winrm quickconfig -transport:https
Set-Item wsman:\localhost\client\trustedhosts *
net localgroup "Remote Management Users" /add administrator
Restart-Service WinRM
🚨 Detection Integration
An Event ID does not exist for Enabling Win-RM as a service. However, we can detect WinRM logins through the Event ID 4624 with a logonProcessName of Kerberos as WinRM uses Kerberos.
Once we have enabled Security Windows logs (this should have been done in the Setup Wazuh section), we should automatically get Windows Event Logs.
Wazuh has a built-in rule detection to detect successful and unsuccessful authentication attempts into a Windows machine. The Windows Security Event IDs are 4624 (for successful) and 4625 (for failed).
- Wazuh Rule ID:
60106 - Description: User:
Windows Logon Success
Navigate to “Server management” ➔ “Rules”. And look up “60106” to view more detail about this rule.
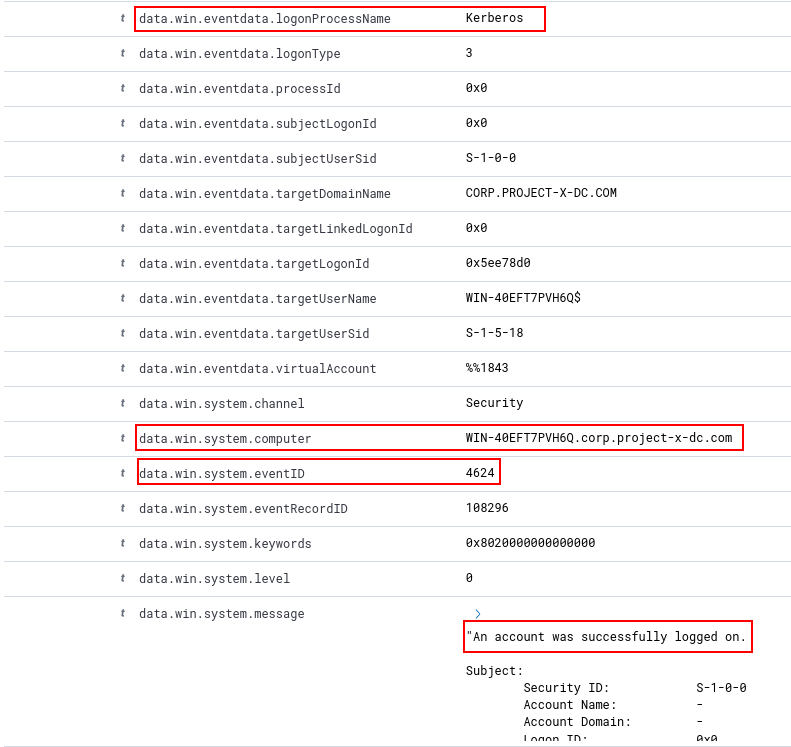
Here is a sample snapshot of a log generated when the WinRM attempt was successful.
Go to “Explore” ➔ “Discover” tab ➔ Make sure wazuh-alerts-* is selected. Look up: data.win.eventdata.logonProcessName: Kerberos
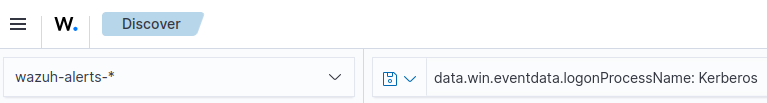
- 👉 You must have a login attempt with WinRM.
Here we can see the logonProcessName, the computer that was logged into, the EventID and the system message from a successful WinRM logon.
🚨 Create Detection Alert
Let’s create an alert for WinRM. We will do something similar to the Failed SSH attempts.
Go to “Explore” ➔ “Alerting”.
Select the “Monitors” tab on the top left.
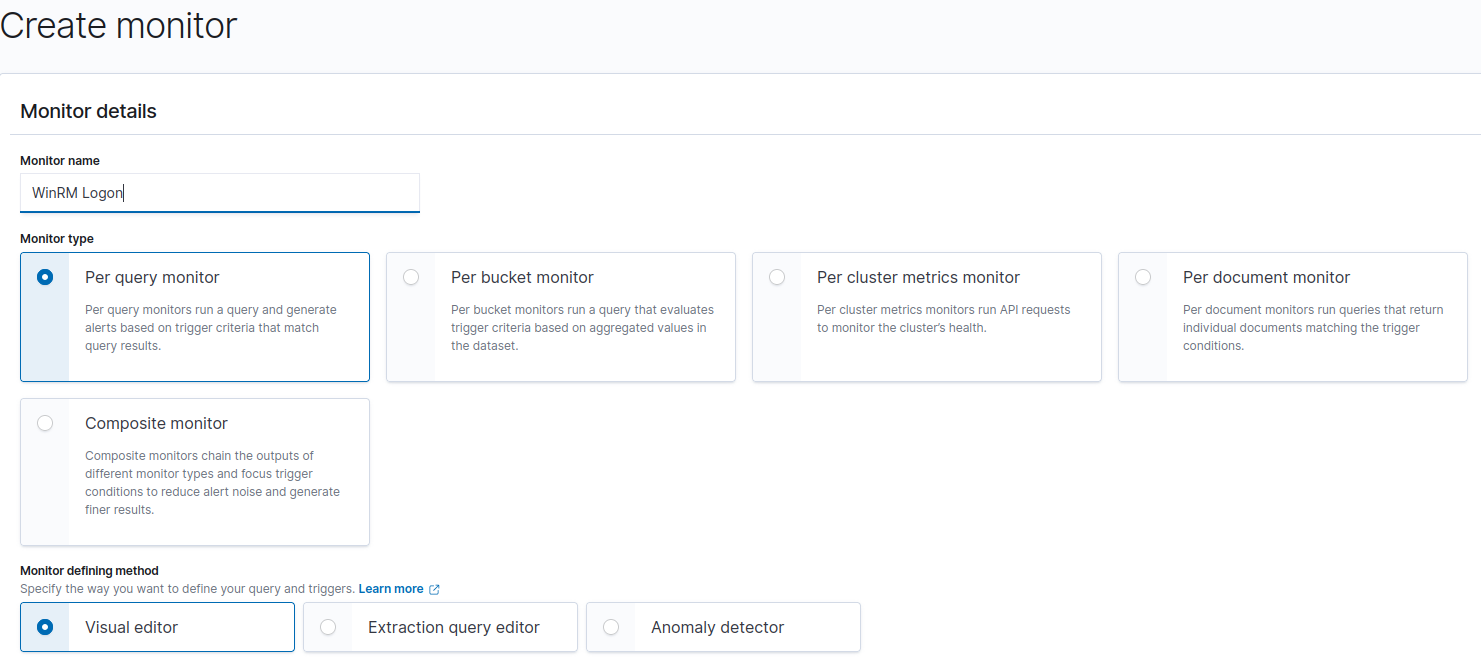
Select “Create monitor”
Here we can create a new monitor.
Title the Monitor “WinRM Logon”. Leave everything else default.
Scroll down to “Data source”. Add the following for the Index, hit the Enter key after typing: wazuh-alerts-4.x-*
For “Time Field” select: @timestamp
Next, we can add a query to select what logs and log fields we would like to monitor.
Based on a sample log of a WinRM attempt, we can construct a query to monitor specific field or value key pairs.
Navigate to the “Data filter” ➔ “+ Add filter”.
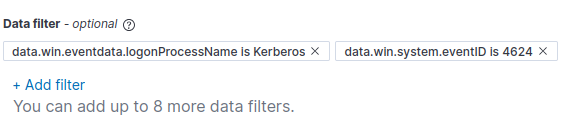
Based on the above sample log, let’s craft a query to select based on the “logonProcessName” and the “eventID” fields.
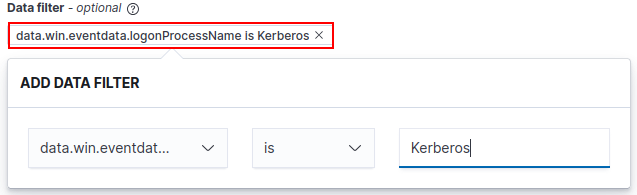
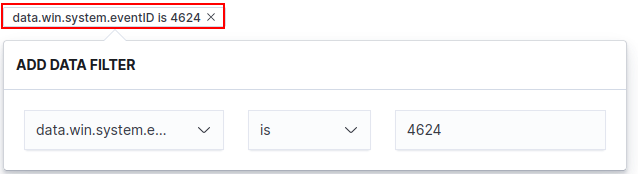
Your “Data filter” tab should now look something like this.
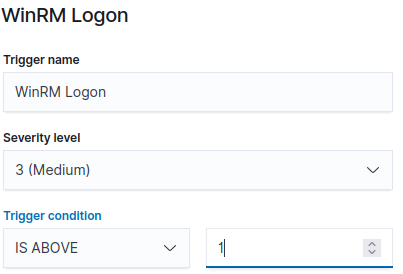
Let’s add a Trigger.
Add the following conditions to the Trigger. We set the “Severity level” to 3 (Medium) and the “Trigger condition” above 1.
Scroll to the bottom and Select “Create”.
Enable RDP on [project-x-dc]
Go to “Settings” ➔ “System” ➔ “Remote Desktop”.
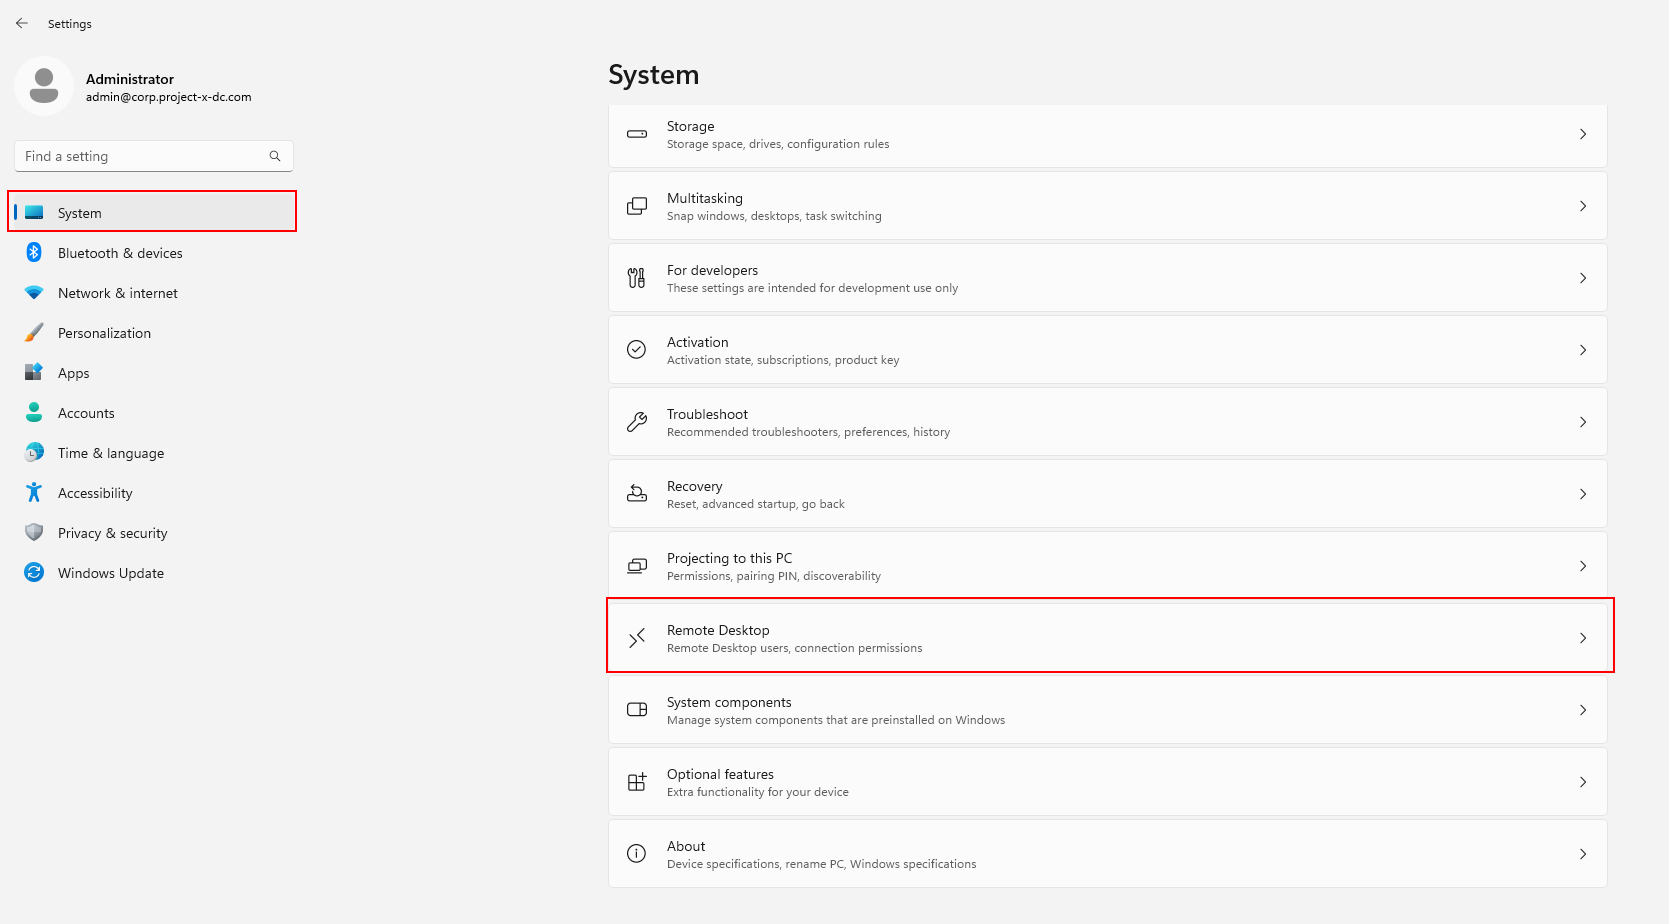
Toggle Remote Desktop to “On”:

🚨 Detection Integration
Wazuh has a built-in rule detection to detect successful and unsuccessful authentication attempts into a Windows machine. The Windows Security Event IDs are 4624 (for successful) and 4625 (for failed).
- Wazuh Rule ID:
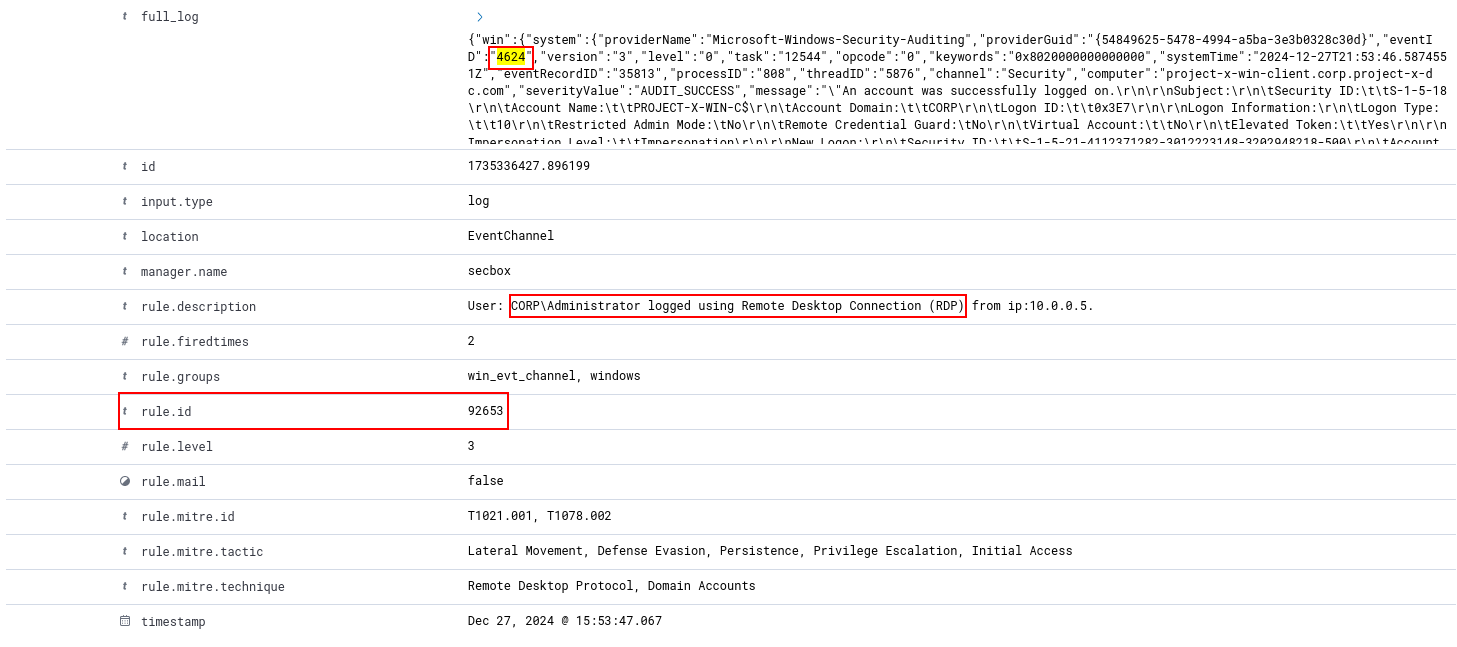
92653 - Description: User:
CORP\Administrator logged using Remote Desktop Connection (RDP) from ip:10.0.0.100.
Navigate to “Server management” ➔ “Rules”. And look up “92653” to view more detail about this rule.
Here is a sample snapshot of a log generated when the RDP attempt was successful.
Go to “Explore” ➔ “Discover” tab.
Look up “4624”.
Or:
data.win.system.eventID: 4624 AND
data.win.eventdata.logonProcessName: User32
(You must have a login attempt with RDP.)
Note
The data.win.event.logonProcessName: User32 denotes what process was used. User32.dll is used as part of the RDP process. How did we know this? We can generate sample logs by logging in over RDP with intentional successful and unsuccessful attempts. From here, the sample logs can be analyzed, and fields + values can be populated. Using your LLM of choice or Google, we can identify why these field values populated.
Here we can see in the rule.description, that a successful logon attempt has been made.
Setup “Sensitive File” [project-x-dc]
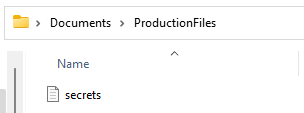
Log into [project-x-dc] go to C:\Users\Administrator\Documents ➔ Right-click ➔ New Folder ➔ Name it “ProductionFiles”.
Navigate inside the folder ➔ Right-click ➔ “New” ➔“Text File” ➔ Name the file “secrets”.
Add whatever content you would like. For this example, we add our sacred statement:
DEE BOO DAH
🚨 Detection Integration
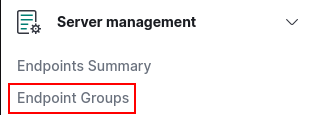
Navigate to “Server management” ➔ “Endpoint Groups” ➔ Select the “Windows” Agent Group.

Select the “Files” tab ➔ agent.conf ➔ Select the Pencil Icon to edit the file.
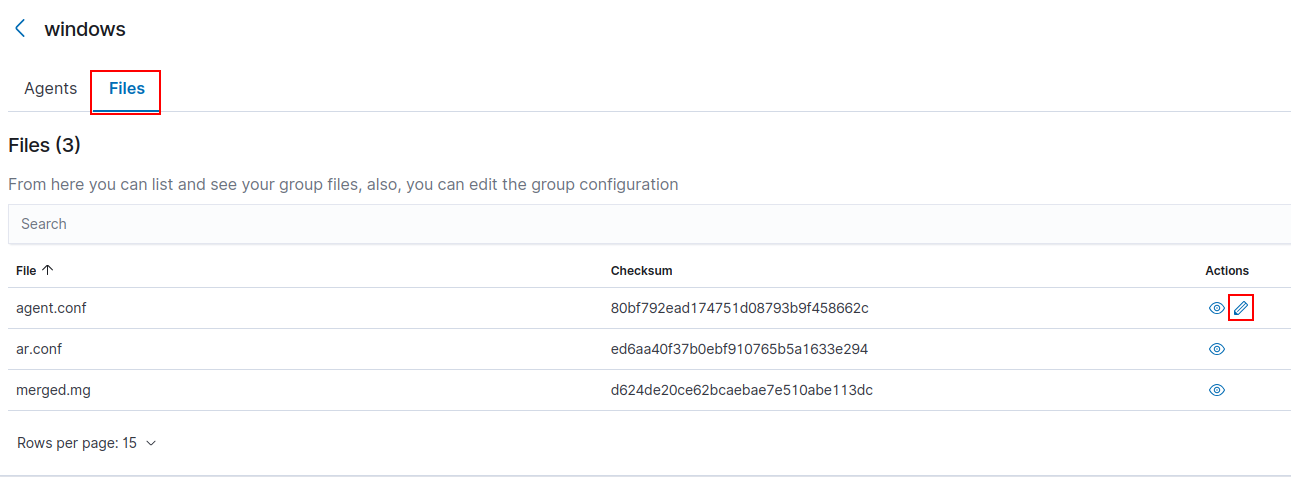
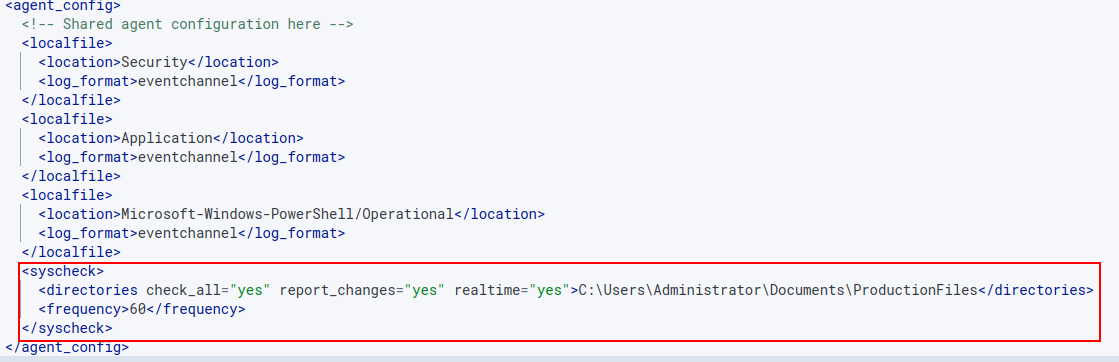
Add the following statement at the end of the file.
 <syscheck>
  <directories check_all="yes" report_changes="yes"
  realtime="yes">C:\Users\Administrator\Documents\ProductionFiles
  </directories>
  <frequency>60</frequency>
 </syscheck>
Note
<directories check_all="yes" report_changes="yes" realtime="yes">: Defines what directory location to monitor. check_all defines the FIM module to scan all files in the specified directory. report_changes enables the system to report content changes made to a file. <frequency> defines how often the FIM module scans in seconds. The default is every 12 hours.
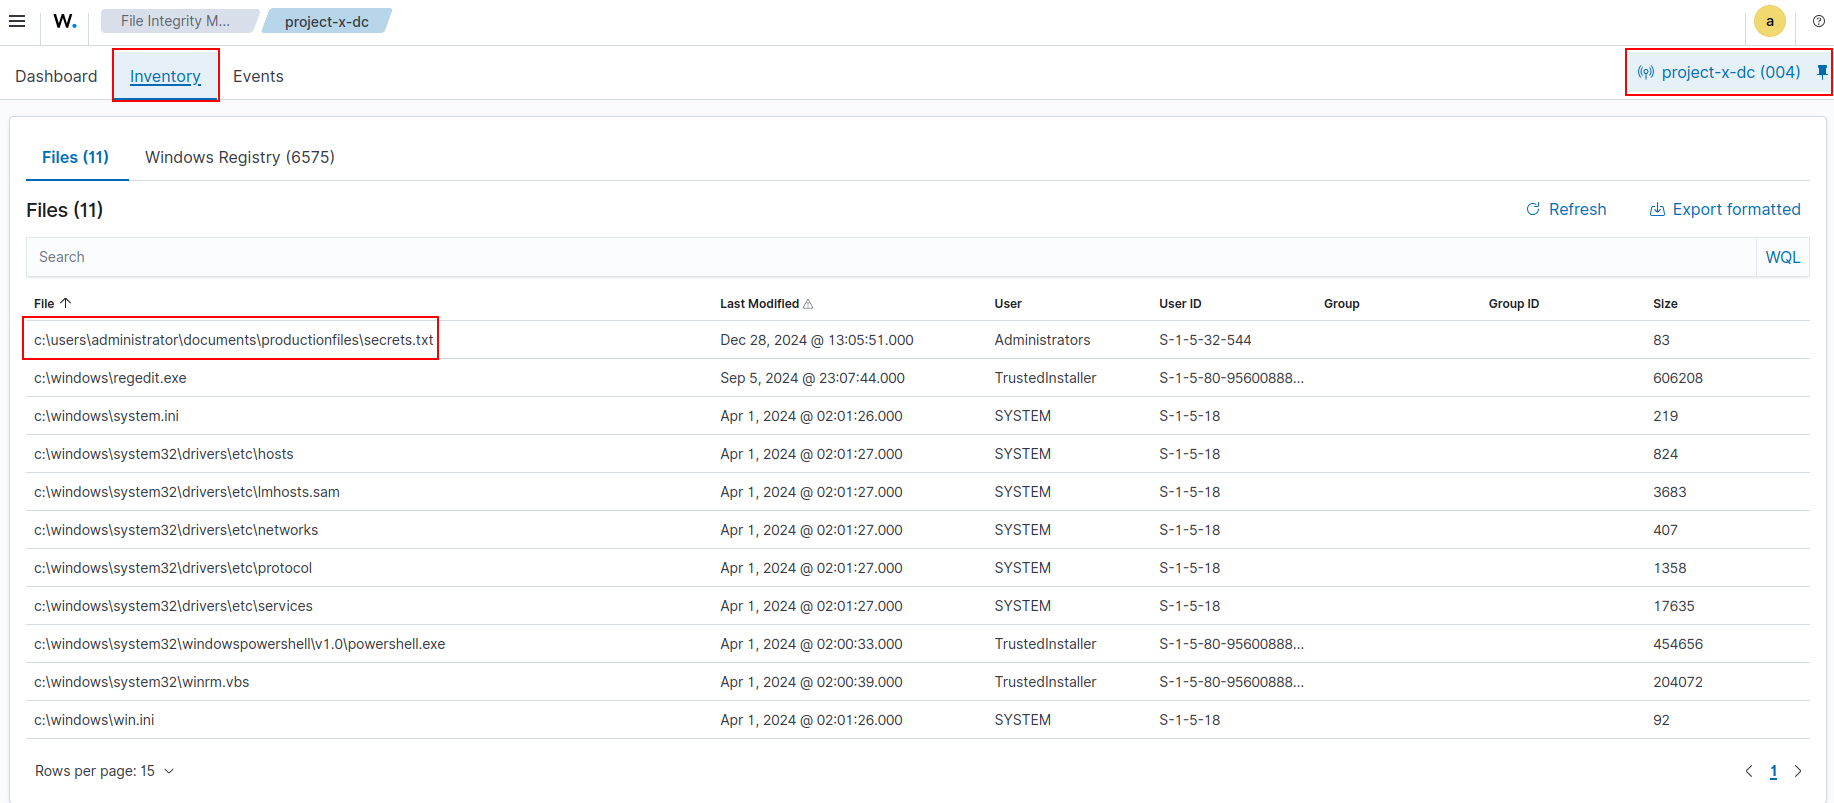
Navigate to the “Endpoint security” ➔ “File Integrity Monitoring”.
Under Inventory there should be a new file path populated. Make sure the [project-x-dc agent] is selected on the right.
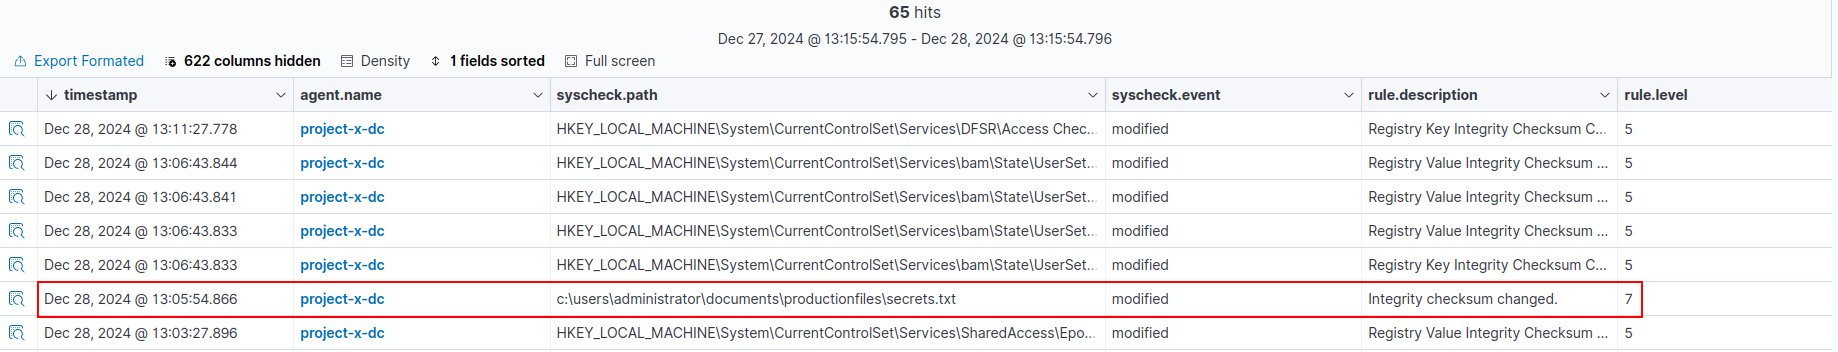
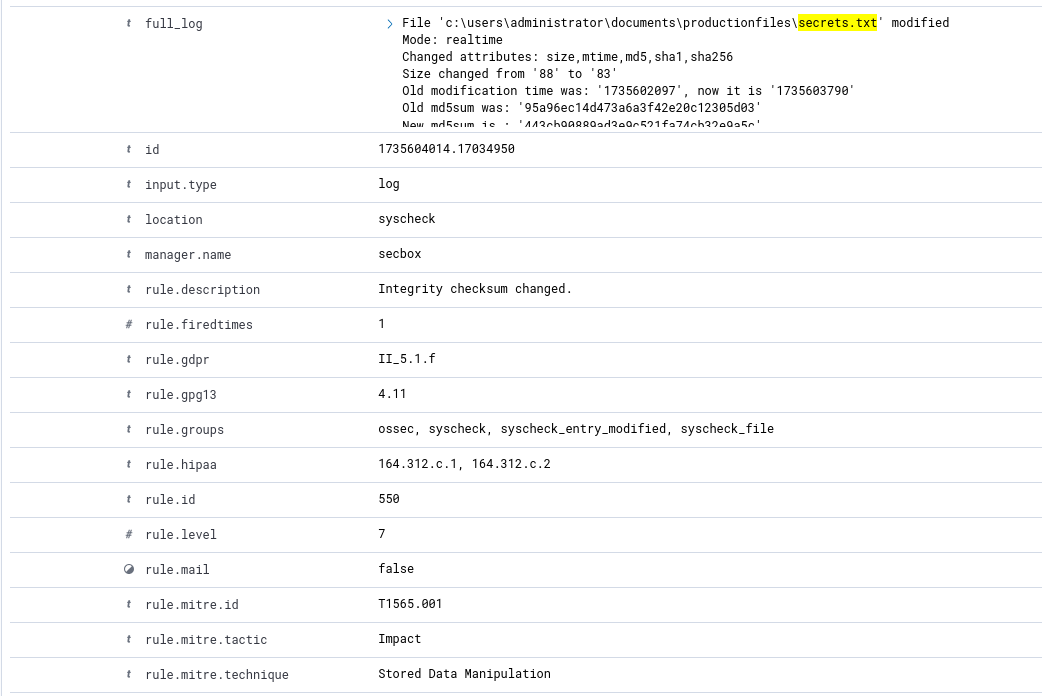
Navigating to the Events tab, if we were to change the content inside the secrets.txt file, we would have an event populate showcasing that the file has been modified.
🚨 Create Detection Alert
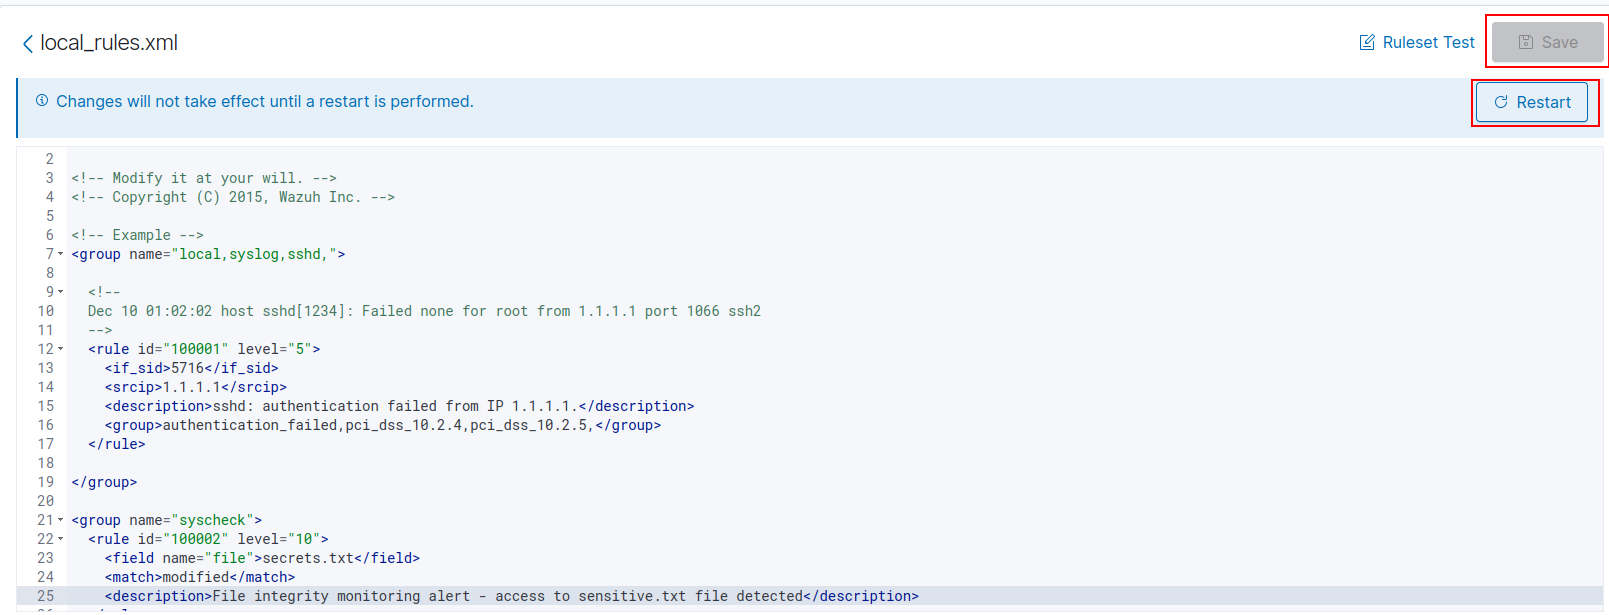
Let’s create an alert for accessing the secrets.txt file. This time, we are going to use the local_rules.xml file to define a custom rule to monitor for changes occurring.
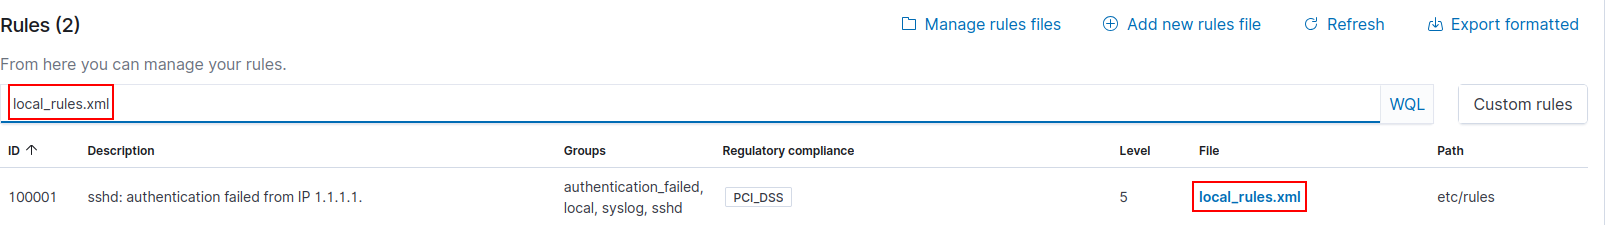
First go to “Server management” ➔ “Rules”.
Search “local_rules.xml” ➔ Click the name under the File tab.
Leave the default rule.
Add the following statement to the bottom of the file.
<group name="syscheck">
 <rule id="100002" level="10">
 <field name="file">secrets.txt</field>
 <match>modified</match>
 <description>File integrity monitoring alert - access to
sensitive.txt file detected</description>
 </rule>
</group>
Click “Save” ➔ “Restart”
After the console restarts.
Go to “Explore” ➔ “Alerting”.
Select the “Monitors” tab on the top left.
Select “Create monitor”
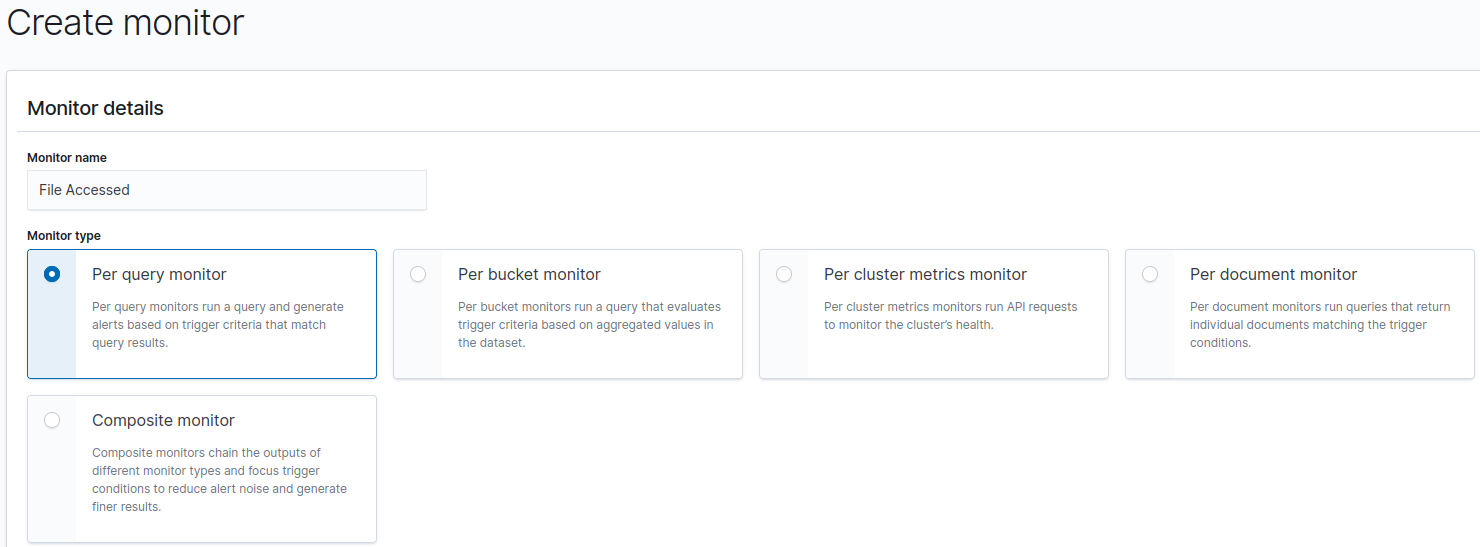
Here we can create a new monitor.
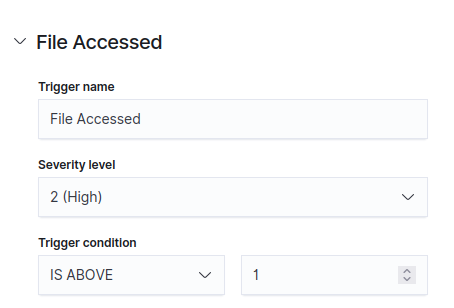
Title the Monitor “File Accessed”. Leave everything else default.
Scroll down to “Data source”. Add the following for the Index, hit the Enter key after typing: wazuh-alerts-4.x-*
For “Time Field” select: @timestamp
Next, we can add a query to select what logs and log fields we would like to monitor.
Based on a sample log of a modified file attempt, we can construct a query to monitor specific field or value key pairs.
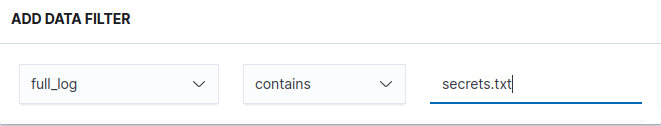
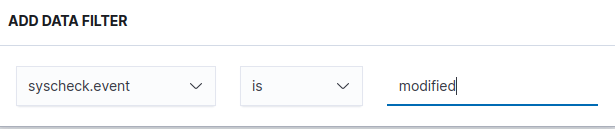
Navigate to the “Data filter” ➔ “+ Add filter”.
Based on the above sample log, let’s craft a query to select based on the “full_log” field containing the secrets.txt file and the “syscheck.event” fields to modified.
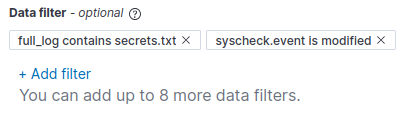
Your “Data filter” tab should now look something like this.
Let’s add a Trigger.
Add the following conditions to the Trigger. We set the “Severity level” to 2 (High) and the “Trigger condition” above 1.
Scroll to the bottom and Select “Create”.
Exfiltration to [project-x-attacker]
The scp (Secure Copy) command-line utility allows you to copy files and directories between two systems over the SSH protocol.
This tool will be used to exfiltrate the secrets.txt file to our [project-x-attacker] machine.
Enable SSH on Kali Machine:
Create a new file under the Kali Machine, this is where we will copy our secrets.txt file to:
🚨 Detection Integration
The above detection will be relied upon to detect changes to the secrets.txt file.
Next, open a new File Explorer Window ➔ Go to C:\Windows\System32.
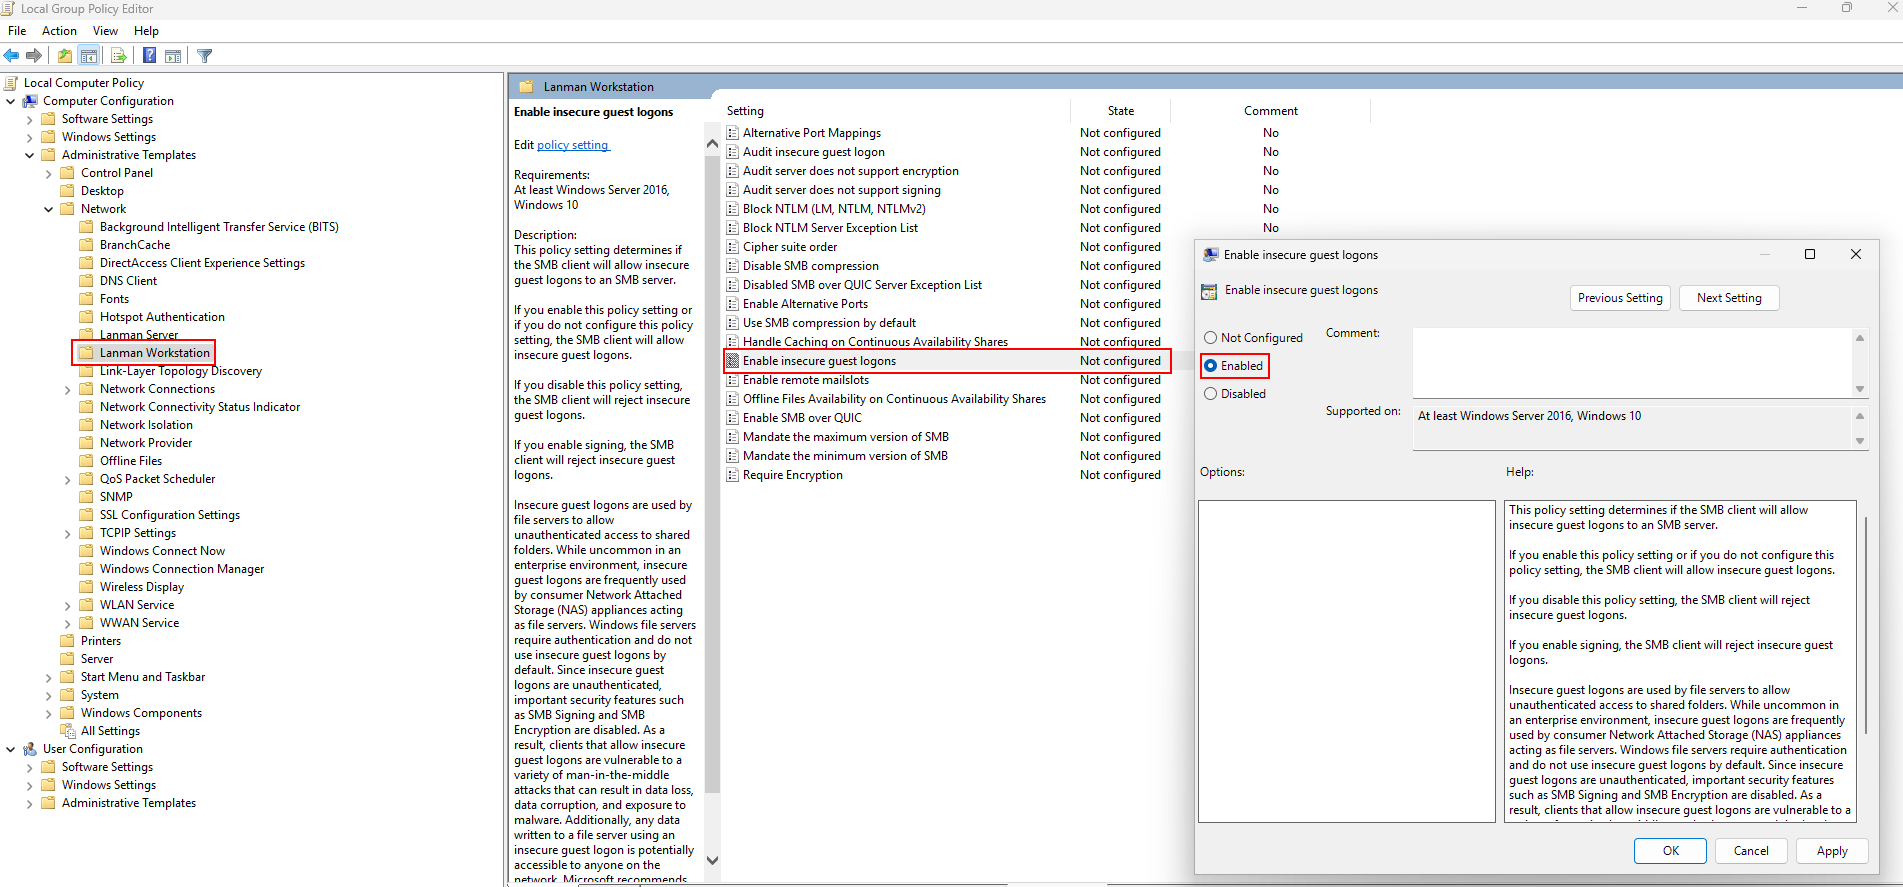
Scroll down until you find “gpedit” ➔ Right-click ➔ Run as Administrator.
Note
We can’t look up Local Group Policy Editor and run as Administrator on a client device managed by Active Directory. This is why we must look for the gpedit program in …\System32.
Go to Computer Configuration ➔ Administrative Template ➔ Network ➔ Lanman Workstation ➔ Double-click on “Enable insecure guest logons” ➔ Select “Enabled”.
Go back to Powershell:
Set-ItemProperty -Path "HKLM:\SYSTEM\CurrentControlSet\Services\LanmanWorkstation\Parameters" -Name AllowInsecureGuestAuth -Value 1 -Force
📷 Take Snapshot of all machines!
Title Snapshots "Vulnerable Environment Setup".